DEIB Metrics: An Essential Guide
Posted on Wednesday, February 9th, 2022 at 2:44 PM
Download This Report[/button]
Introduction
At this point, the business case for diversity, equity, inclusion, and belonging (DEIB) is clear. Our own research (see Figure 1) shows the relationship between having a strong DEIB culture, and critical individual and performance outcomes.1
Yet, for years, the representation of diverse populations in organizations improved almost imperceptibly.
Then we had a global pandemic and the rise of a social justice movement, sparked by the murder of George Floyd. Along with that came the heightened awareness that the pandemic was impacting diverse populations much more—particularly for women and people of color who were dropping out of the workforce at higher rates than other populations. As a result of this confluence of events, organizations began making big promises on DEIB in the summer of 2020.
When this happened, one of our first questions was how organizations would show that they’d made good—or at least made progress—on those commitments. While DEIB metrics measurements designed to understand DEIB—are the obvious answer, how to select, collect, use, and maintain those metrics is not so clear.
Thus, this research initiative on DEIB metrics and analytics was born. The first article in this series, “DEIB Analytics: A Guide to Why & How to Get Started,” provides leaders with a plan on how to begin using DEIB metrics and analytics. We’ve shared an 8-step guide with details on the actions and considerations that organizations need to take to effectively implement DEIB metrics.

Figure 1: The impact of a strong DEIB culture on individual & organizational outcomes | Source: RedThread Research, 2022.
This article: An essential guide to DEIB metrics
This report focuses more narrowly on the appropriate metrics and analytics for DEIB. We aim to provide DEIB leaders, people analytics practitioners, HR business partners, workforce planning and talent management leaders with:
- A foundational understanding of the different metrics that can be used to measure and track their DEIB performance
- Insights on how those different metrics might vary, depending on their org’s sophistication with DEIB and analytics
This article is based on a wide range of information, including our research on:
- People analytics technology2
- DEIB analytics3
- DEIB strategies4
- DEIB technology5
- A literature review of DEIB and analytics6
- Interviews with ~20 people analytics and DEIB practitioners
Our research focuses specifically on the people within an organization’s existing workforce. We know a number of other DEIB metrics exist that orgs should also consider, such as those which apply to their supply chain, community efforts, ESG (environmental, social, and governmental) requirements, etc. While critical, those areas are outside the scope of this report.
We would also like to mention that this report is the first of its kind, in that it attempts to provide a holistic look at all talent-related DEIB metrics. Any first try will miss some critical elements and we acknowledge this report may be incomplete. We invite you to share any suggestions, feedback, or additions you think appropriate by emailing us at [email protected].
The DEIB space is evolving quickly, and we will only make progress by putting out our best ideas and amending them quickly as new information becomes available. Thank you for being part of that process and pushing forward toward greater opportunities for all.
Defining DEIB
Let’s start our essential guide by defining our terms (see Figure 2).

Figure 2: Definitions of diversity, equity, inclusion & belonging (DEIB) | Source: RedThread Research, 2022.
Why are DEIB metrics & analytics important?
Some of the common reasons why leaders start to focus on DEIB metrics and analytics include:
- Creating a clear business case for DEIB
- Measuring the return on investment (ROI) of DEIB expenditures
- Tracking the impact of critical DEIB initiatives
In addition to these, a few more reasons why orgs should use DEIB metrics and analytics include:
- Busting myths or addressing anecdotes that may or may not be true
- Checking assumptions about DEIB
- Meeting consumer, investor, and employee expectations when it comes to progress on DEIB
While these are all good reasons to use DEIB data, one of the most compelling motivations for why DEIB is critical was articulated by one of our interviewees:
“Companies have been setting diversity goals for decades but have struggled with “goal-getting”—meaning the clear accomplishment of those goals—because of a lack of feedback and data to help them get after those goals every day. Without any feedback on progress, companies lose sight of the goals.”
—Phil Willburn, Head of People Analytics & Insights, Workday7
Why do orgs find DEIB data difficult to use?
Many leaders struggle to use DEIB data for reasons such as the following (see Figure 3):
- Challenges in identifying and using appropriate metrics. Historically, very few orgs have attempted to track metrics for DEIB and even fewer have ventured beyond collecting diversity data. Often, leaders are unsure which metrics can and should be measured for DEIB. Even if they’re able to identify them, leaders then often face challenges around tracking and integrating the data.
- Legal, security, and privacy issues. DEIB data involves sensitive information—and this comes with legal and security challenges around data collection, storage, and usage. As a result, some orgs hesitate to collect and use it. Additionally, employees may be hesitant to provide it, due to data privacy and access concerns.
- Poor alignment with goals. Orgs find it challenging to use the data if there’s no or poor alignment between the data collected and the overall DEIB goals that the company wants to achieve. As result, there can be a sense of helplessness, which can render the data not as helpful.
- Data responsibility issues. Because DEIB data can reside in multiple systems under several functions (e.g., HR, D&I, IT, sales), there can be a lack of clarity around who is primarily responsible for the data and how / when it can be shared.
- Data interoperability issues. Related to the previous point, orgs often find it challenging to use data collected in one system on another due to integration issues and capabilities of the tech solutions in place.

Figure 3: Challenges to using DEIB data by orgs | Source: RedThread Research, 2022.
For this article, we focus on the first bullet to help orgs identify the range of metrics they can use.
“When you have members of a minority group who are leaving at a higher rate, that’s telling you something is wrong, and it helps steer you to where the problems are. It needs to be measured at quite a low level in the company because that’s the way you find where your hot spots are.”
—Fiona Vines, Head of Inclusion and Diversity and Workforce Transition, BHP8
Clarifying diversity metrics
As we highlight in our report “DEIB Analytics: Getting Started,” the essential first step to creating diversity metrics is collecting appropriate demographic data. Essentially, the data collected should allow orgs to answer 3 questions:
- What does our current workforce look like across different levels (hierarchy) and functions / business units?
- Who are we hiring (internally and externally) across different levels?
- Who is leaving the org and at which level(s)?
It’s important that leaders not only look at simplistic diversity numbers, such as gender or race / ethnicity—they also need to consider multilevel diversity, known as intersectionality, such as Black women or gay Asian men. This additional analysis helps leaders understand their workforce at a more nuanced level, and make better recommendations and changes.
Many orgs track basic diversity numbers: 96% of U.S. companies report the gender representation of their employees at all levels and 90% report gender representation at senior levels.9 However, far fewer orgs look at intersectionality: Only 54% of companies track gender and race / ethnicity—such as Black or Latina women in senior leadership.10
Figure 4 is a list of common demographic data that we’ve seen orgs collect (for a more comprehensive list of data that could be collected, please see our definition in the earlier section). It’s important to note the significant legal limitations in different countries as to which of the following can be collected and stored. Your org’s legal counsel should always be involved in determining which data to collect.

Figure 4: Commonly collected diversity demographic data | Source: RedThread Research, 2022.
While comparatively easy to collect and analyze, orgs should be wary of trying to do everything at once when it comes to diversity metrics. Leaders should first figure out the immediate challenges or business issues they want to solve for and identify the appropriate metrics accordingly.
Examples of diversity metrics
Figure 5 offers a list of the metrics that orgs can use to measure diversity. Many orgs already collect most of these metrics through their human resource information system (HRIS) or applicant tracking systems (ATS). By adding a demographic lens to these metrics, orgs can quickly understand the state of diversity within the org.
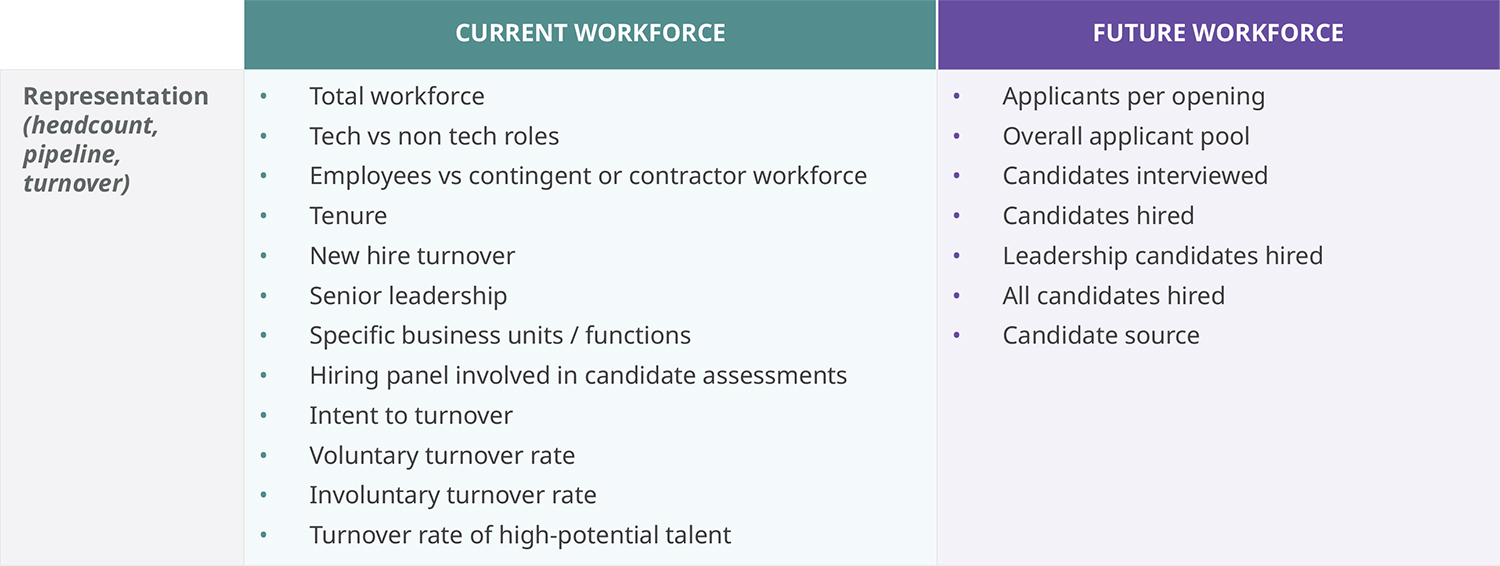
Figure 5: Metrics to measure diversity | All items should be measured by number and demographic distribution, unless otherwise stated. | Source: RedThread Research, 2022.
Real-World Threads
Using diversity data to improve hiring11
As part of its diversity goals, an industrial manufacturer wants to achieve 50% female parity in leadership roles by 2030, and create a globally diverse workforce with inclusive leaders and teams. In order to do so, the company needed an accurate picture of their current workforce diversity mix and the recruiting pipeline.
Working with a technology provider, the company looked at its recruiting pipeline to better understand how women and minorities move through the full process from recruiter review to meetings with the hiring manager. A review of the talent acquisition process revealed that the number of women applicants was disproportionately lower than their male counterparts. Additionally, as women moved through the hiring process, they were more likely to be dropped during the interview process.
To tackle these challenges, the company implemented:
- Programs for hiring managers, including unconscious bias training
- Workshops on inclusive conversations to enable a better hiring experience for women and minority candidates moving through the process
As a result of these actions, the company is in a better position to meet its 2030 goals. It’s also working to attract more women and minority job applicants through strategic partnerships with the Society of Women Engineers and the National Society of Black Engineers, among others.
Understanding equity metrics
Equity metrics can help orgs understand the effectiveness of their processes, and identify unfair or biased systems, practices, and policies. Research conducted in 2021 revealed that when employees are treated fairly, they’re:12
- 8 times more likely to look forward to going to work
- 3 times more likely to have pride in their work
- 4 times more likely to want to stay a long time at their company
Equity metrics can be measured from data collected via several sources, such as:
- Learning and development data
- Performance management data
- Payroll
- Employee engagement / experience data
Ensuring fairness in the distribution of resources, opportunities, and access can help leaders address existing systemic inequities within the orgs. The point to note here is that the distribution needs to be fair, not equal. The difference between these two concepts is shown in Figure 6.
Thus, the goals of measuring and tracking these metrics should not be to ensure equality or sameness for everyone, but rather to:
- Detect areas in which systemic inequities exist
- Identify differences in capabilities, resources, and needs
- Implement systems and process that take these into account
While orgs have a strong case for creating a fair and equitable environment, many struggle to do so. For example, our 2021 study on performance management trends revealed that only 48% of employees believe their performance evaluation process is fair and consistent.13 As orgs continue to manage unique needs and challenges for different employees, leaders will increasingly need to address issues around managing fairness and equity across varied employee experiences.

Figure 6: Visualizing equity
Source: Robert Wood Johnson Foundation, 201714
Examples of equity metrics
Below is a list of metrics that orgs can use to understand, measure, and track equity. All metrics should be analyzed by the different demographics collected by the org to understand the differences in opportunities, access, and renumeration for various groups.
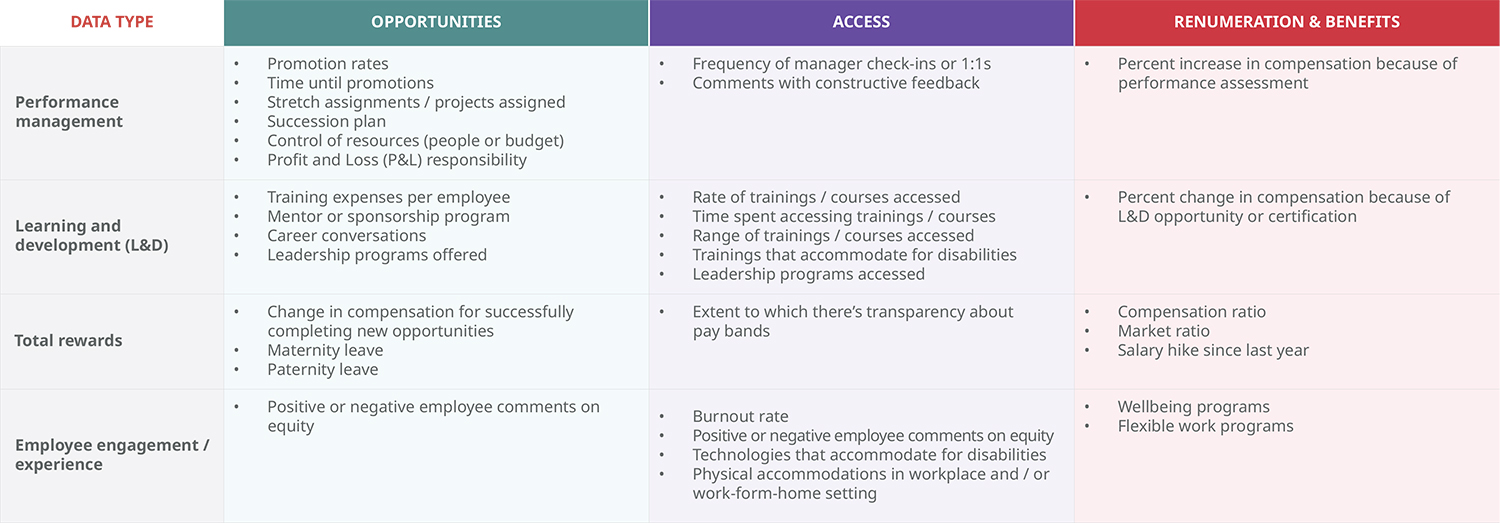
Figure 7: Metrics to measure equity | All items should be measured by number and demographic distribution, unless otherwise stated. | Source: RedThread Research, 2022.
Real-World Threads
Using people analytics to create a more equitable environment
- Uber.15 Shortly after the start of the COVID-19 pandemic, Uber’s People Analytics team found that employees with children younger than 5 years of age scored lower than the company average on engagement and satisfaction metrics. To help provide them with the support they needed, the company added some flexibility options to help those employees balance childcare with work.
- A midsized U.S. law firm.16 Upon auditing its performance evaluations, the company found that only 9.5% of people of color at the firm received mentions of leadership in their performance evaluations—more than 70 percentage points lower than white women. The company changed the evaluation form that broke down job categories into competencies and asked that ratings be supported by at least 3 pieces of evidence. They also developed a 1-hour workshop to teach everyone how to use the new form.
As a result of these changes:
- Comments with constructive feedback for people of color increased from 17% the year before to 49%
- Women also received greater constructive feedback (from 10.5% the previous year to 29.5%)
Identifying inclusion metrics
After diversity, inclusion is the most common area that organizations tend to measure. According to a 2018 study, a little more than 50% of orgs measured inclusion.17 While the focus and urgency around this area has increased over the years, few orgs are doing anything beyond tick-the-box exercises.18
“Let's say that the engagement score for our company is high at 80%, and that makes us happy. And then you realize that 80% of your employees are White—which means that you’re not really hearing the voice of those under-represented groups. Inclusion analytics is about pulling that out, and making sure you have a good sense of where everybody's falling on all of your core metrics.”
—Hallie Bregman, PhD, Global Talent Strategy and Analytics Leader19
There are a few reasons why orgs should focus on understanding and measuring inclusion. Orgs with an inclusive culture:20
- Are twice as likely to indicate they met business goals from last 3 years
- Are 81% more likely to indicate high customer satisfaction
- Have employees that are 45% more likely to stay
- Have employees that are 2 times more likely to give a positive Net Promoter Score® (NPS)
If these reasons weren’t enough, the volatility of 2020 and 2021 has resulted in many companies facing tough questions around their efforts in this area. According to a recent analysis of S&P 500 earnings calls, the frequency with which CEOs talk about issues of equity, fairness, and inclusion on these calls has increased by 658% since 2018.21
Inclusion metrics can help orgs understand whether employees feel:
- Accepted by others in the workplace
- Integrated into and a part of the wider organization
- Respected for their work by others
As alluded to above, orgs can typically approach inclusion metrics in 2 ways—employee perception data and object data. We explain the differences between the 2 in Figure 8.

Figure 8: Employee perception & objective data for inclusion | Source: RedThread Research, 2022.
Examples of inclusion metrics
Figure 9 offers a list of metrics that orgs can use to understand, measure, and track inclusion. These include metrics that directly impact an employee’s sense of inclusion (e.g., mentor relationships and strength of connections with others), as well as some not-so-obvious metrics that can drive inclusion (such as the average distance between office and home, which can adversely affect employee experience).

Figure 9: Metrics to measure inclusion | All items should be measured by number and demographic distribution, unless otherwise stated. | Source: RedThread Research, 2022.
Real World Threads
Understanding and embedding inclusion within everyday behaviors
When it comes to inclusion analytics, an international electronics company believes in embedding inclusion in everyday behaviors, activities, and processes across the company. It’s been collecting data and doing the research for more than 5 years to understand the key behaviors that impact inclusion at the organization. Because of its groundwork, the company was able to identify 4 metric areas that they needed to track and analyze on a regular basis:
- Net Promoter Score
- Job fit
- Employee engagement score
- Intention to turnover
The people analytics team approaches these metrics in 2 ways, by:
- Checking in with new hires and collecting the data from them
- Making sure that all employee surveys administered by the org contain questions that tie into these metrics
By collecting this information regularly, the company has been able to identify pain points and concerns experienced by diverse populations, especially in the current times—and plan initiatives and appropriate decisions around topics, such as vaccinations, return to offices, rollouts of wellbeing programs, and measurement of the financial impact of those programs.
Specifically, the company has extended its remote working policy because they determined that return to office will disproportionately impact their female workforce and potentially increase their turnover by 33%. It also rolled out a $300 COVID Wellbeing credit that can be used towards children’s tutoring costs, wellbeing app subscriptions, tax preparation costs, etc. to help employees—especially parents and caregivers who are more impacted by the pandemic. Additionally, the company re-examined and adjusted its communication and approach on vaccine education as result of employee feedback.
In addition to these measures, the people analytics team has also been able to use insights from inclusion analytics to identify areas in which different groups need support. For example, the company found that its millennial workforce needed and wanted greater support for financial planning as part of its benefits program. The company added specific financial wellbeing offering in its annual benefits open enrollment to support Millennials and Gen Z.
In another example, the company was able to build more inclusive policies around statutory and floating holidays that take into account the fact that employees with different religious backgrounds might want to take different holidays.
As a result of these efforts:
- Net Promoter Score of the company increased by 7%
- Confidence in Leadership increased by 8%
- Employee Engagement increased by 5%
Defining belonging metrics
While closely related to inclusion conceptually, it’s important that orgs pay equal attention to measuring and understanding belonging. We explain how belonging is different from inclusion in Figure 10. A high sense of belonging among employees can result in:
- An increase in employee happiness and employee engagement, which in turn impacts employee retention22
- A significant increase in job performance23
- A reduced turnover risk and a decrease in employee sick days24
Analytics based on belonging metrics can serve as a leading indicator of critical diversity outcomes as well. Specifically, belonging metrics can help orgs to:
- Gain a deeper understanding of the sense of security experienced by employees
- Find out if employees feel connected with the org’s values and purpose
- Bolster their ongoing efforts around inclusion and equity
“When someone is experiencing a sense of Belonging, they feel freer, they feel more creative and their opportunity to potentially have an impact at work is significantly increased.”
—Kate Shaw, Director of Learning, Airbnb25

Figure 10: Belonging versus inclusion | Source: RedThread Research, 2022.
Examples of belonging metrics
Figure 11 offers a list of metrics that orgs can use to understand, measure, and track belonging. While some metrics speak to belonging directly (e.g., a belonging index as part of an engagement survey), others should be used in combination with one or more additional metrics to gain a better understanding. For example, by looking at metrics around the number of resources groups offer and the participation rates for them, orgs can try to understand if employees feel supported. Employee feedback comments specific to these topics can provide even more context of the underlying issues.

Figure 11: Metrics to measure belonging | All items should be measured by number and demographic distribution, unless otherwise stated. | Source: RedThread Research, 2022.
Real World Threads
Using nontraditional metrics to add depth to understanding26
A number of companies look beyond the obvious metrics and data to gain a deeper understanding of the current state of DEIB within their orgs. For example:
- Cindy Owyoung, the Vice President of Inclusion, Culture, and Change at Charles Schwab, looks at the metrics around growth and vitality of the company’s employee resource groups (ERGs). By tracking metrics such as the number of ERGs and the number of participants in them, the company is able to really understand the work Schwab’s ERGs are doing and whether they are providing value to their members.
In addition, these metrics can also be indicative of whether employees have the support they need to be able to participate in the ERGs and do the work that needs to be done.
- Zoom Video Communications is another company that lays emphasis on such metrics. According to Damien Hooper-Campbell, the company’s Chief Diversity Officer, these nontraditional metrics “serve as bellwethers.” The company looks at metrics around the ERGs and keeps a track of the number of allies who are active in ERGs.
According to Hooper-Campbell, “If you have a women’s employee resource group, do you have any men who are part of it? How many non-Latinx folks are part of your Latinx employee resource group and are contributing to it, or coming and listening to it?”
Such metrics can offer a more nuanced understanding of the extent of support experienced by different groups across the org.
DEIB metrics: Strengths & limitations
DEIB metrics are most effective when multiple types of metrics are combined to gain a clearer picture of DEIB holistically. (See Figure 12.) For example, by combining inclusion metrics with equity metrics, orgs can understand not only that different groups may be feeling less included, but also the specific reasons (e.g., unequal development opportunities or biased performance reviews) for it.
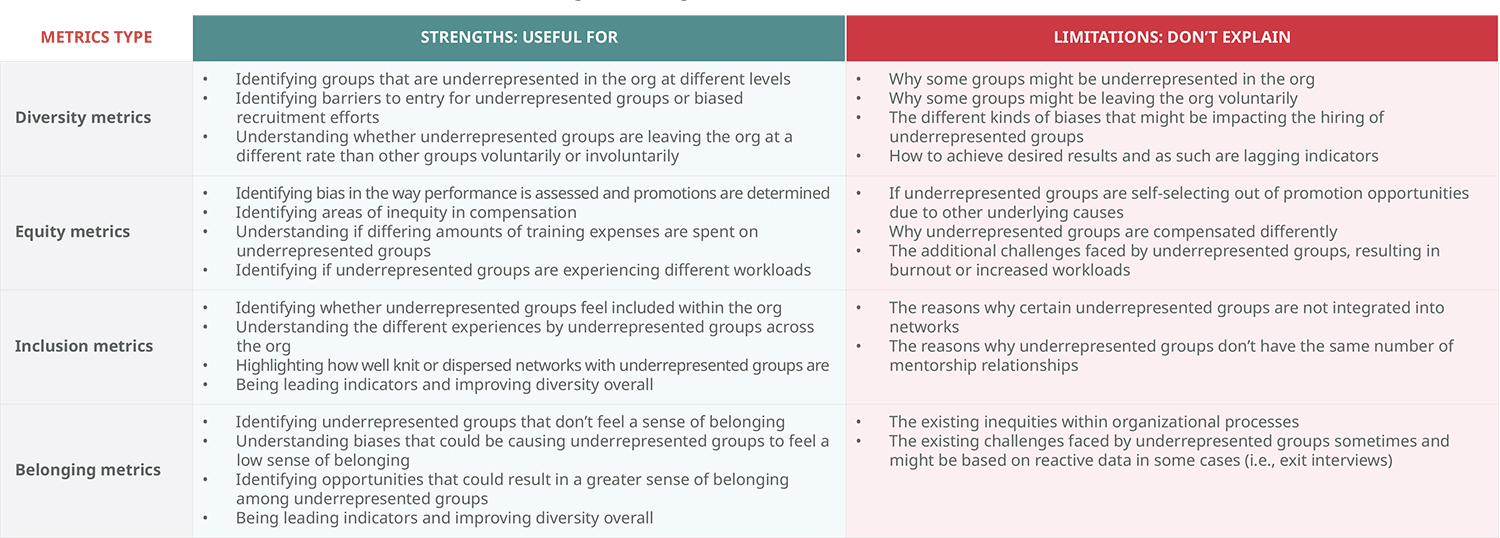
Figure 12: Strengths & limitations of DEIB metrics | Source: RedThread Research, 2022.
Using data sources for DEIB
Now that we’ve covered the specific metrics, let’s look at the data sources orgs can use for them. Orgs should keep a few things in mind when using such data:
- All data should be looked at with a demographic lens. For example, the number of trainings accessed by the workforce would mean little unless analyzed to see if white women access training more often than Black women.
- Data are more powerful when combined with other data. For example, data from the HRIS that shows exit rates should be combined with data from exit interviews, surveys, and employee comments on external review websites.
- Connectivity between data sources is essential to being able to use the data effectively. Data interoperability, or the ability for different data between systems to work together, is a necessity in order for orgs to drive DEIB. As such, they should look for tech and tools that enable them to do that.
- The partnership between DEIB and people analytics functions is critical. As we mention in our report “DEIB Analytics: Getting Started,” DEIB and PA leaders often come from different backgrounds and parts of the org, which mean partnership challenges may exist that must be addressed. The insights and expertise of both groups are necessary to use and interpret DEIB metrics effectively.
Common data sources for DEIB
Figure 13 shows that most of the data sources can be used for more than one DEIB area.
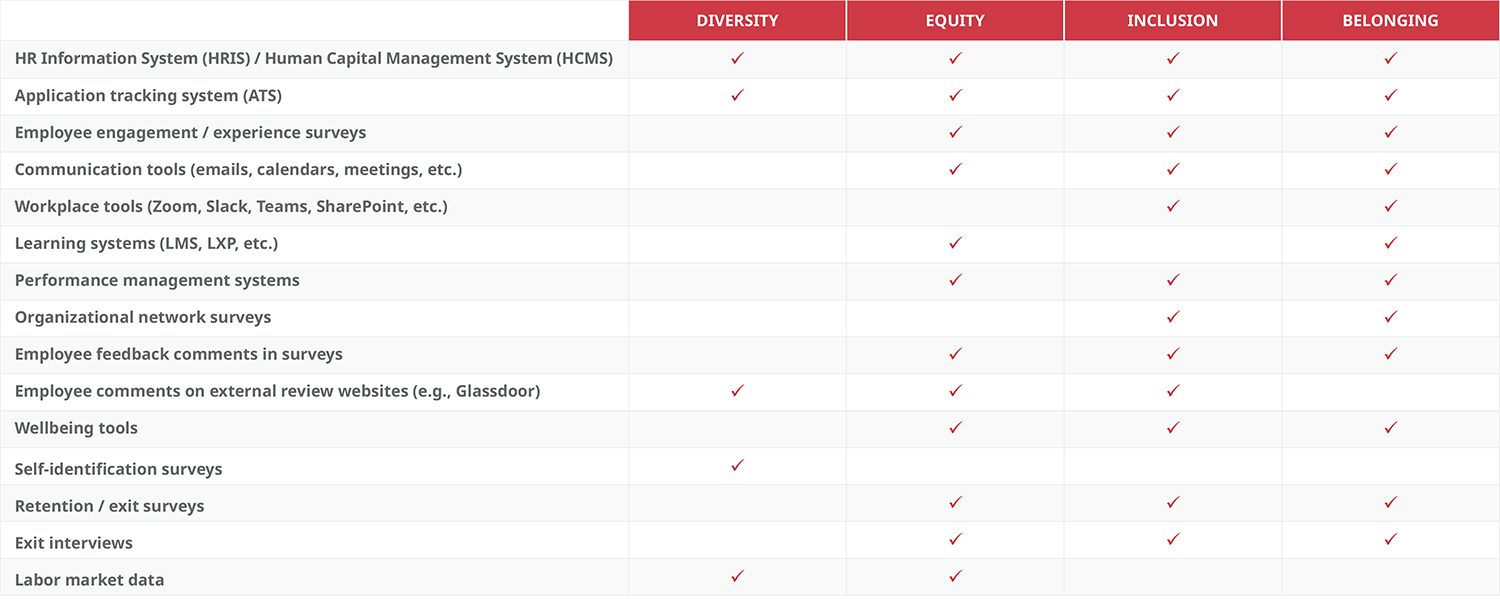
Figure 13: Data sources for DEIB metrics | Source: RedThread Research, 2022.
Beginning the DEIB metrics journey
Orgs at the beginning of their DEIB journey should try to answer the question: What’s the current state of DEIB within the org? As such they should focus on 2 things:
- Understanding the state of diversity
- Identifying “low-hanging” challenges—areas that need attention and are easy to quickly start working on
When it comes to selecting metrics, orgs should start with the basics, like:
- Getting their basic demographic data in order
- Measuring metrics around headcount, retention, and turnover to understand diversity
- Leveraging employee perception data—such as engagement surveys, feedback, and focus groups—to understand how different groups perceive DEIB at the org
Orgs should ensure that the selected metrics are clearly tied to overall strategy and that processes exist to track their progress.
A people analytics leader we spoke to mentioned creating a Python script to pull different metrics that they’re already collecting around talent acquisition, internal mobility, performance, engagement, and exit rate to understand where the biggest gaps are between different employee groups. This allowed them to quickly identify areas with the biggest gaps, start working on them, and track progress over time.
“The DIB world is so enormous, and you could do a thousand things. It's hard to understand where to start and where to focus your efforts. We should be intentional about identifying our biggest gaps. Every company has some problems around DEIB, but we should work on finding where our biggest internal gap is and focusing on that first.”
—Head of People Analytics, a large technology company

Figure 14: Questions to ask yourself | Source: RedThread Research, 2022.
Moving up to an intermediate level with DEIB metrics
Once the orgs have a clear sense of where they stand or the “what,” they need to understand the “why,” such as:
- Why do certain groups experience a low level of inclusion and belonging?
- Why are certain groups being promoted at lower rates than others?
Orgs can begin to supplement existing data to gain a deeper understanding of the systemic issues that impact DEIB. When it comes to metrics, orgs should look at data from existing systems:
- Learning & development data
- Performance management data
- Payroll data
- Wellbeing data
- Data from employee feedback comments
A technology provider shared an example of a customer project that conducted text analysis on data from employee feedback to understand why promotion rates for women were low in a company. The analysis revealed that the existing initiatives to drive promotions favored men and received positive feedback from them, as compared with women. Some of the concerns that surfaced included difficulties faced by women around childcare and the inflexibility around work schedules. The analysis of the data allowed the company to identify the systemic issues that were negatively impacting promotion rates for women and their overall DEIB efforts.
“Metrics are a way to communicate what’s important. Orgs should limit themselves to how many metrics they push. It’s like the weather, I don’t want a million different metrics to know if the weather is good of not. Orgs should figure out the goal (what is ‘good’ weather) and the metrics should help achieve that.”
—Dirk Jonker, Chief Executive Officer, Crunchr

Figure 15: Questions to ask yourself | Source: RedThread Research, 2022.
Using a mature approach to DEIB metrics
The questions orgs should look to answer at this stage are:
- How can we address existing issues and drive our DEIB efforts effectively?
- How can we measure progress longitudinally?
- What creative analyses or approaches might help us answer questions we haven’t yet been able to answer?
When it comes to metrics and data, orgs should consider complementing existing data with:
- Network data
- Communication data from sources such as emails, calendars, meetings, etc.
- Workplace tech data from tools used by employees to get work done such as Zoom, SharePoint, Slack, Teams, and Asana
- Employee reviews and comments on external websites
Orgs should consider using advanced approaches to people analytics such as connecting text analytics with social network data. Text analysis can help orgs identify existing gaps in inclusion. Network analysis can help identify influencers. Orgs can relay feedback to influencers and leverage them to fill those gaps and drive greater efforts.
DEIB is a continuous effort rather than a “once-and-done” approach. Orgs should look externally to compare their performance to avoid becoming complacent in their efforts and update their goals regularly. Specifically, orgs should look at how other high-performing orgs that rank high on DEIB are performing, instead of industry or national averages.
“When it comes to selecting metrics, don’t go with the flow, and get something off the internet or another company. How you define metrics really matters, and orgs need to be intentional about what and how they measure them.”
—Lydia Wu, Head of Talent Analytics and Transformation, Panasonic North America

Figure 16: Questions to ask yourself | Source: RedThread Research, 2022.
Conclusion
When it comes to DEIB, orgs need to do more than provide training and courses to employees. They need to think about and approach it in a holistic manner so that it’s built into the way the business is managed, instead of something that’s an afterthought or special.
To that end, orgs need to:
- Understand where they currently stand and how are they perceived by their employees. They should know what issues currently exist.
- Understand why those issues exist. Orgs need to find out the reasons why they are falling short in those areas.
- Identify what can they do to fix them. Orgs should plan their targeted initiatives and interventions in order to get the maximum value and results from their efforts.
In order to achieve that, companies need to apply a greater focus, and put more emphasize on using metrics and data than they currently do. As we’ve mentioned before, the growing demands from customers, investors, and employees around more action on DEIB is likely to keep increasing. Orgs stand to lose a lot more if they do nothing, not just in terms of lagging performance, engagement, and innovation—but also in future talent that’s going to place a lot more importance on these issues going forward.
It's time companies take their DEIB data seriously. Moving forward, we hope to see a greater acceptance of and creative thinking around how these data and metrics can be used to enable all people and do their best work.
Appendix
Below we share our own as well as indices used by other organizations to help understand their DEIB culture.

Figure 17: RedThread’s DEIB index | Source: RedThread Research, 2022.

Figure 18: Gartner inclusion index | Source: Gartner.27

Figure 19: University of California San Francisco’s Belonging Index | Source: University of California San Francisco.28
Quick Summary: Modern Performance Management Trends
Posted on Tuesday, January 4th, 2022 at 10:06 AM
Over the past few years, several orgs have dramatically changed their existing practices, including those around performance management. Our latest study on performance management trends compares our fall 2019, fall 2020, and new fall 2021 data on performance management practices. We also conducted a literature review of more than 60 articles, a roundtable discussion with over 25 leaders, and a quantitative survey of 621 HR leaders and employees and conducted over the summer and fall of 2021.
This infographic (click on the image below to get the full version) highlights key insights from our report Modern Performance Management Trends.
As always, we’d love your feedback at [email protected]!


Learning methods: What to use, how to choose, and when to cut them loose
Posted on Tuesday, November 30th, 2021 at 3:02 PM
The panic—and the opportunity
The pandemic forced most L&D functions to throw out their tried-and-tested, in-person, instructor-led-learning playbooks. Indeed, in the early months of the pandemic, one of the most common questions we got was, “How do I get all my learning online, ASAP?”
And then there were several months when leaders realized that they might never get all their classroom training online, and what’s more, maybe that shouldn’t be the goal. Even before the pandemic, it was increasingly clear that the waterfall development methods, reliance on courses, and one-size-fits-all approaches of the past were no longer working.
Leaders realized they might never get all their classroom training online, and what’s more, maybe that shouldn’t be the goal.
For one thing, these approaches haven’t supported the ways employees learn for a long time. Survey after survey has shown that employees learn more through the informal stuff—and therefore rely more on it—than the heavy, expensive courses L&D functions have tended to focus on.
And for another, the logistics of traditional learning approaches keep orgs from being as agile and responsive as they need to be in an unstable and fast-changing world. Today orgs can’t afford to wait 6 months for a training course to come online, constantly take employees away from their work to learn, and narrowly define “learning” so that only the formal stuff counts. Instead, they need a continuously upskilling workforce. And even the very best instructional design team can’t do that by themselves.
As orgs settle into new ways of working—hybrid, remote, flexible, whatever—leaders dealing with this new reality are hyperaware of the need to do learning and upskilling differently. And not just different-for-this-point-in-time, but differently forever. The ways people work have changed and will continue to change; the ways they learn must help them keep pace with and even stay ahead of those changes.
The ways people work are changing; the methods they use to learn must help them keep pace with those changes.
Learning methods—literally, the ways people learn—are key to the question of how orgs can enable learning and upskilling differently. There’s a wealth of learning methods that can be leveraged in different ways to help employees develop their knowledge and skills.
To do this, though, L&D functions must know what those methods are and decide on the right ones, in the right combinations, for their org.
Which brings us to this study. Over the past few months, we’ve investigated both the methods themselves and how organizations are choosing them. We looked at over 60 articles, hosted a roundtable on the topic, and talked in depth with 15 learning leaders.
This report outlines what we found. Specifically, we’ll introduce:
- An overview of learning methods and how they align to RedThread’s Employee Development Framework
- How leaders are deciding (on a continual basis) what methods work best for their orgs
- Real-life examples of how orgs are leveraging learning methods in different ways to help employees develop
The next section introduces a comprehensive list of learning methods we’ve found in our research and discusses some of the major trends we’re seeing. We then examine how those methods map to the RedThread Employee Development Framework and how different methods enable different employee behaviors.
(Mostly) familiar methods, new applications
When we started this research, we were in search of the novel: innovative learning methods that cropped up in response to (or in spite of) the pandemic. But, surprisingly, most of them were familiar to us. Figure 1 shows the major learning or development methods we found through our literature review, interviews, and roundtables.

Figure 1: Learning methods in this research | Source: RedThread Research, 2021
That isn’t to say we didn’t see innovation: if we hadn’t, this would be a very short paper. But it didn’t take the form we expected. While the discrete learning methods were familiar, some of the ways those methods were being utilized were surprising.
While many learning methods are familiar, the ways they’re being used are new and innovative.
We’ll provide specific examples throughout the paper; here are the general trends we’re seeing.
More automation
Unsurprisingly, we have all gotten much better at using technology over the past 2 years. Also unsurprisingly, that improvement has yielded greater know-how about automating learning. Many of the vendors we spoke to are actively taking the “stupid work,” like curation of learning content, off the plates of L&D professionals and using automation to enable employees to find the learning content and opportunities they need.
More personalization
As L&D has gotten better at automation, we’re also seeing more personalization as orgs move away from rote, unchanging learning paths to something much more dynamic. We’re not just talking about branching scenarios: L&D functions are leveraging learning methods that help to personalize the entire development experience, helping both the individual and the org accomplish their goals.
Leveraging the existing
They say that necessity is the mother of invention, and we’ve seen that in the past couple of years. Many L&D functions are leveraging what already exists—content, technology, ways people are already learning—instead of investing in or developing new ones. For example, one company we spoke with ditched a “social learning platform” for WhatsApp groups, which accomplished the same goals in a platform employees were already using.
More in the work itself
The increasingly urgent conversations in many board rooms and in cyberspace about skilling, reskilling, and upskilling have changed the types of methods orgs are choosing for development. Traditional methods like classroom training will always have their place, but increasingly apprenticeships, individual development plans, job rotations, and stretch assignments are being leveraged to build skills while the employee is doing the work. Our friend Chris Pirie likes to say, “Learning is the new working.”
More self-service
The pandemic made asynchronous and self-service learning an imperative, building on the fact that employees are increasingly likely to create their own career paths rather than following traditional, predictable ones. In response, orgs are offering more self-service, employee-driven learning methods, rather than curricula that serve only the most obvious or common career paths.
More combinations of methods
We mentioned earlier that many of the methods identified by this study are familiar. What’s new, though, is that more combinations of those methods are being used to accomplish certain development goals. L&D leaders are thinking more holistically about using learning methods to accomplish a goal—so a leadership course may have a coaching element, an on-the-job capstone project, and technology that nudges participants toward the right behavior, rather than relying solely on classroom instruction.
In the midst of all this innovation, it might be helpful to introduce a structure that shows how all these learning methods can complement one another and be used systematically toward org goals. That's where we turn next.
Learning methods and the Employee Development Framework
A few years ago, we introduced the RedThread Employee Development Framework, shown in Figure 2. This framework describes the behaviors orgs should be enabling in their employees in order to have a solid learning culture. We use this framework to make sense of the world of employee development and to help leaders identify any gaps they should be paying attention to.

Figure 2: RedThread Employee Development Framework | Source: RedThread Research, 2019
The Employee Development Framework offers a structure leaders can use to understand the universe of learning methods.
The Employee Development Framework shows that L&D functions should focus their time on enabling employees to:
- Plan: Understand their career options and the development they’ll need to get them where they want to go.
- Discover: Find the opportunities and content that will help them develop the knowledge and skills they need to take their career in the direction they want.
- Consume: Easily access relevant learning content—a challenging feat, given the amount of content available.
- Experiment: Practice new knowledge and skills on the job; try, fail, and learn from that failure.
- Connect: Learn from one another to gain new knowledge and skills.
- Perform: Learn on the job and improve performance at the same time.
For this study, we mapped the learning methods we identified earlier in this report (Figure 1 above) against the 6 behaviors in the Employee Development Framework. The results are shown in Figure 3 below. Similar methods are then grouped together under each behavior. This clarifies which learning methods can be leveraged to enable which behaviors.
Different learning methods fall into different categories and enable different behaviors.
We see, for example, that courses enable consumption, talent marketplaces enable experimentation, mentoring enables connection, and so on.

Figure 3: Learning methods in the Employee Development Framework | Source: RedThread Research, 2021
The remainder of this section addresses each of the 6 behaviors and the categories of learning methods that enable them. We’ll also highlight real-life examples of orgs using these learning methods to enable each behavior.

Figure 4: Methods for planning development | Source: RedThread Research, 2021
Helping employees Plan their development
Helping employees plan their careers hasn’t always been considered part of L&D’s job. In recent years, however, L&D functions have recognized that career planning is a critical part of employee development: As L&D moves away from a one-size-fits-all approach to development, employees will need help figuring out what their own paths look like.
But L&D functions aren’t the sole owners of career planning. It touches other areas like performance and workforce planning. To successfully enable employees to plan, L&D functions need to work with other HR teams and business units to ensure systems, policies, processes, and methods are synced up. And as we’ll see below, some of the methods that support planning may not be owned by the L&D function, either, highlighting the need for close collaboration.
Learning methods that enable employees to plan their careers fall into 2 broad categories (shown in Figure 4):
- Information gathering
- Development planning
These 2 categories approach planning in different ways. Let’s look at how they do this in more detail.
Methods for information gathering
Info-gathering methods help employees collect information about the skills they have and the skills they need. Methods in this category include:
- Skills assessments
- Skills ratings
- Informational interviews
- Critical org skills definitions
These methods help employees develop a clear understanding of their own current state as well as the “skills market” they will likely face in the future. Leading practices surface info about both the supply side (employees’ skills) and demand side (org needs) of that market.
Methods for development planning
Development-planning methods help employees identify and commit to the development activities they’ll undertake to achieve their goals. They enable employees to plan their development activities, and their order. Methods for doing this development planning include:
- Career coaching
- Individual development plans
- Goal-setting
- Action planning
Orgs leveraging these methods well tend to tie together development planning, performance, and the employee’s and org’s skills needs. While learning and skills platforms are making this more possible, it takes some insight on the part of talent leaders to align all the methods, as well as the motivations for using those methods.
Real-world thread: Digitizing the career development plan
Career development plans (CDPs)—also known as individual or personal development plans—are one method orgs use to link development planning, performance, and skills. Until relatively recently, though, CDPs tended to be manual, static, and paper-based: An employee filled out a form that listed their goals and planned development activities. The employee had to find development opportunities themselves, list those activities on the form, and update the form as activities were completed. All too often CDPs would be filed and forgotten because they quickly felt irrelevant.
Career development plans are becoming more relevant, helpful, and dynamic as they are digitized and linked more closely to development, performance, and skills.
Digitization can help address these challenges by automating pieces of the process and linking CDPs to systems that contain relevant info (e.g., HRIS, learning libraries, skills platforms).
For example, an American multinational tech company makes CDPs that incorporate skills assessments available to all employees. Employees can use the online CDP tool to:
- Self-assess their skills in an area they’re interested in
- Ask their manager to verify the skills
- Receive recommendations for relevant learning opportunities to develop the skills
- Log activities they do to develop the skills
The CDP tool tracks the difference between current and desired skills and recommends learning paths to close the gaps, updating the recommendations as new activities are logged.1
Digitizing CDPs has 3 main benefits. First, it takes much of the paperwork burden off employees. Second, the automatically updated learning recommendations are far more relevant and useful to employees than a list they themselves created a year ago. And third, data from CDPs can give the org a dynamic picture of the workforce’s current and projected future skills.

Figure 5: Methods for discovering development opportunities | Source: RedThread Research, 2021
Helping employees Discover the right development
Discovery is a critical component of learning: it connects employees to the development (content and opportunities) they need. L&D functions should make it easy and intuitive for employees to find relevant learning opportunities.
It’s a challenge that’s only getting harder as the ocean of learning content and development opportunities gets bigger and bigger. In the past few years, L&D functions and vendors alike have tackled this discovery problem with a vengeance. Earlier this year we offered our take on making sense of the chaos of learning content.2
Orgs are using increasingly scalable, automated methods to help employees find personalized, relevant development opportunities.
Here, we focus on how orgs are using learning methods to help employees discover learning opportunities more easily. Learning methods that enable discovery fall into 3 categories (shown in Figure 5):
- Centralized “push” communications
- Employee browsing / searching
- Recommendations
We discuss each in more depth below.
Centralized “push” communications
Almost all the leaders we talked to said that L&D functions rely on “push” communication methods to tell employees about available development opportunities.
Methods in this category include:
- Informational emails
- Newsletters highlighting offerings
- Nudges to explore or complete assigned training
The big pro of centralized “push” communication methods is that they can be easier to administer and automate. It is relatively easy to send mass emails to specific groups—for example, all new managers are sent a list of available courses, learning pathways, and articles that pertain to them. It’s also getting easier, through technology, to personalize these communications at scale based on preferences or career paths.
Employee browsing / searching
Employees can discover development opportunities on their own by searching or browsing. The “Netflix of Learning” movement relies heavily on employees knowing what they want to consume and how it may benefit their career. Methods in this category include:
- Searching or browsing on the internet
- Searching or browsing the org intranet
- Searching or browsing in an LMS, LXP, or other learning platform
A challenge with these methods is helping employees find development opportunities that are relevant to them. To tackle this problem, many orgs are implementing methods that rely on ratings and reviews to surface the best opportunities. We’re also seeing methods that rely on artificial intelligence to parse massive amounts of text, audio, and video content to draw out themes, assign tags, and serve up highly relevant content.
Recommendations
Learning methods in the Recommend category personalize suggestions for development opportunities for each employee. Recommendations help employees quickly cut through the masses of learning content and opportunities to find something relevant to them. This category includes:
- Automated recommendations (learning platforms)
- Recommendations from managers
- Recommendations from colleagues / peers / social network
Initial, non-scientific observation tells us that employees may value certain types of recommendations over others, as the following example shows.
Real-world thread: Personalized recommendations to help employees discover
Different types of recommendations hold different value to employees—a fact that may influence leaders’ choices about learning methods.
Matthew Daniel, a principal at Guild Education and former head of learning innovation and technology at Capital One Bank, once ran a test to see how employees relied on different types of recommendations for learning opportunities. The results were:
- Employees relied overwhelmingly on recommendations from a manager or teammate
- Recommendations from business executives were next
- Recommendations from the learning tech system or L&D team were dead last, because “What do they know about me?”
Daniel cautioned:
“Keep in mind that not all recommendations are made equal." – Matthew Daniel, Principal, Guild Education3
Although Daniel’s experiment was limited in size, it aligns with our own observations that the more personalized a recommendation, the higher value employees tend to give it. However, we expect to see more and more improvements in learning tech tools’ ability to deeply personalize recommendations at scale. As leaders consider what learning methods to invest in, it’s worth keeping in mind the value of these personalized recommendations.
A final note on methods for Discovery: Discovery has always been important, but it is becoming even more important in the wake of some of the social justice movements. Many orgs are realizing that their Discovery methods are inherently biased. Our work with orgs has surfaced 3 explicit ways this bias makes itself known:
- Opportunities open to only a few. As orgs make use of more learning methods, they should open those opportunities to as many as possible. One complaint we have heard over and over is that fairly inexpensive (or even, if scaled, free) learning opportunities are only open to some people in some parts of the org. Is there really any harm in opening up a basic accounting class to someone who is currently in supply chain?
- Not making opportunities explicit. Information within an org often flows through informal channels; many learning opportunities, like job rotations or special assignments, are open only to those who know about them. We have seen a recent push by orgs to explicitly state all opportunities so that everyone knows what’s available.
- Failing to take data into account. Finally, data can help orgs understand who their message is reaching (or not). One org found that the majority of people taking advantage of an upskilling opportunity were white males, presumably because they had the most discretionary time. Data can help leaders understand how their messaging needs to change in order to provide opportunities to all.
L&D functions have quite a bit of power when it comes to Diversity, Equity, Inclusion, and Belonging (DEIB). Understanding the data with a focus on inclusivity can ensure that they wield that power for the good of the employees and the org as a whole.
Figure 6: Methods for consuming learning | Source: RedThread Research, 2021
Helping employees Consume relevant learning content
Enabling employees to consume content is where L&D functions have historically spent most of their time and energy. Creating and delivering training courses is a core L&D competency. Which is great: there will always be a place for courses.
What this research emphasizes, however, is that there’s much, much more to employee development than courses alone—and L&D needs to expand its repertoire of learning methods accordingly.
There’s an abundance of learning methods that enable employees to consume learning content—and L&D needs to expand its repertoire.
Given L&D’s historical focus, it is unsurprising that there’s an abundance of methods that enable employees to consume learning. At their core, these methods aim to deliver relevant (and, ideally, personalized and timely) learning opportunities to employees. They fall into 3 categories (shown in Figure 6):
- Consuming in groups
- Consuming individually
- Interacting with content
Let’s look at these categories in more detail, highlighting leading practices for each.
Consuming in groups
This category encompasses methods that orgs have traditionally thought of as “learning”—instructor-led courses that primarily “download” information from a teacher to a group of students. It also includes other methods that primarily rely on one-way flows of information to a group of people. Specifically, methods included in this category are:
- Instructor-led courses (virtual, in-person, hybrid)
- Town halls
- Live webinars
Because these methods are delivered in a prepared format to a large group of people, they don’t allow for much personalization in terms of content or flow, and generally don’t take into account (too much) individual needs or preferences.
Not surprisingly, the pandemic has motivated L&D functions to look for ways to mitigate the shortfalls of these methods. A whole category of tech that integrates with traditional meeting software has popped up to help prevent “Zoom fatigue” and make the online environment more engaging.
Some miss the mark dramatically (conducting meetings via Second Life? For reals?), but we applaud any attempt to engage participants through interactive elements, reflections, discussions, and the like.
Consuming individually
Consuming content individually includes methods where employees receive “downloads” of information individually, at their own pace, and often, without the blessing of their L&D function. Methods in this category include:
- Self-paced online courses
- Books
- Articles / blogs
- Videos
- Podcasts
- User-generated content
- On-demand webinars
This list shows that orgs are taking content well beyond the simple course. For years, the e-learning course was the default for individual consumption—and there is still a place for it. But orgs are beginning to adapt to the way their employees want to learn, through curated articles and videos, podcasts, webinars, and books.
Some orgs provide access to these learning methods by adopting a next-gen LXP content aggregator to leverage machine learning and create a “front door” from which all learning can be accessed. Others have built content directly into the work, providing access to information where it is most needed. Still others invest in digital or actual libraries to provide access to learning methods that appeal most to employees.
Interacting with content
Learning methods that encourage employees to interact with content add dimension to the experience; instead of being passive participants, employees become active ones, interacting with the content and / or each other. The methods included in this category are:
- Gamification
- Interactive apps
- Adaptive learning
- Nudges
- Bots
Leaders tell us that these methods can be a blessing or a curse, depending on how they’re used. For example, apps can be seen as gimmicky or bothersome if used incorrectly. But with the right application and engagement, they can be really helpful. One leader said about a SMS-based learning app:
“An HR business partner in my org is using a texting app to develop new habits. It texts her a little bit of info every day. She told me recently, 'I didn’t realize how much I’ve learned!'" – Kelly Rider, CLO, PTC4
All of these learning methods are enabled by tech and share a potential shortcoming: they can be used as hammers in search of a nail. L&D functions should understand when these methods are most appropriate and utilize them accordingly.
Real-world thread: Implementing a system with little formal training
Professional services firm Deloitte US was launching a project to implement a new technology that would help improve processes in its audit and assurance business. Previous comparable system implementations had been accompanied by roughly 24 hours of classroom training, which created some challenges for employees who often faced huge separations (in terms of time and distance) between learning and actually using the new system.
Deloitte LLC's shift in learning methods made learning more relevant, contextualized, and useful to employees.
Deloitte’s US L&D team, headed by Eric Dingler, Chief Learning Officer, Deloitte LLP, decided to take a totally new, “minimal formal training” approach to onboarding employees to the new system. The team reduced the number of classroom training hours from 24 to 3 and ensured those 3 hours of training were delivered right before an employee started to use the new system.
They also developed over 175 learning assets that were delivered as popups as employees used the new system. The assets, which included videos and text, were based on skills (rather than roles) and aligned to employees’ workflows. Many assets could be skipped if the employee already had the skill. They were regularly updated based on usage data.5
We liked this example because it so clearly demonstrates how a shift in methods can make learning more relevant, contextualized, and useful to employees, driving adoption of new behaviors.

Figure 7: Methods for experimenting with new skills | Source: RedThread Research, 2021
Helping employees Experiment with new knowledge and skills
A well-established and growing body of research points to the importance of experimentation, failure, and reflection in learning.6 The more opportunities employees have to try new skills in realistic environments and then reflect on their mistakes, the better.
The methods we saw that help employees experiment with new knowledge and skills fell roughly into 2 categories (shown in Figure 7):
- Experimenting within learning experiences
- Experimenting on the job
Experimenting is a behavior where the L&D function doesn’t have complete control. For example, they can purposely build reflection exercises and role plays into the stuff they create, but they can’t ensure managers help employees learn from mistakes on the job—they can only prepare managers to do so.
L&D functions should put in place learning methods, systems, and processes to make experimentation easier and more natural.
This means that helping employees experiment is more about putting the right learning methods, systems, and processes in place so that experimentation is as easy and natural as possible.
Experimentation within learning experiences
When L&D functions think about enabling experimenting, they usually go straight to experimentation within a planned learning experience. Which is not surprising, nor is it wrong.
L&D functions can have quite a bit of sway in helping employees use new knowledge and skills. A phrase we hear a lot is “experimenting in a safe place.” This generally includes methods like:
- Sandboxes
- Simulations
- Role plays
- AR / VR / immersive 3D
- Reflection activities
In each of these instances, employees are given the opportunity to try out their new knowledge in low-risk situations. These types of methods are excellent in situations (and cultures) where mistakes have large consequences, whether those consequences are perceived or real.
Some of the situations where these methods may be the most appropriate option include:
- Realistic simulations that take participants through catastrophic failure scenarios or scenarios that would be physically dangerous in real life (e.g., nuclear power plants, active shooter scenarios)
- Role plays that help new managers learn how to give appropriate, non-biased feedback
- Use of AR / VR to help employees get over their fear of public speaking, or as part of a DEIB training to build empathy
These experimentation methods tend to be a bit more costly than many other methods, and this is where we caution L&D leaders to use some discretion: Many we spoke to are enamored with the idea of AR / VR, for example, but just because it can be used in a situation doesn’t mean it should be.
Experimenting on the job
The methods that fall in this category are some of our favorites—and for good reason. We’ve long been proponents of defaulting to the work first to teach new knowledge and skills. This means that L&D functions should think about developing skills in the context of the work and try to build opportunities into the flow rather than defaulting to learning activities that would take employees out of their job, and therefore out of context. Methods that fall in this category include:
- Job rotations
- Talent / gig marketplaces
- Volunteering outside of work
- Stretch assignments
- Job shadowing
- Reflection activities
Most of L&Ddom understands that these methods are effective. Why, then, are they not used more? We think it comes down to the fact that the L&D function often doesn’t “own” them. They don’t have direct control over the systems that determine job rotations or stretch assignments, for example.
L&D functions often don't "own" the systems that determine job rotations or stretch assignments—but that's changing.
That is changing. In many orgs, for example, the L&D function is one of the strongest proponents of a talent or gig marketplace. They see these marketplaces as a way not just to build new skills and knowledge, but also to collect information about those skills and knowledge, helping the L&D function to determine where the greatest need is.
L&D functions are also being included in larger discussions about talent development in general. Performance, engagement, mobility, and employee development are becoming 1 conversation instead of 4, making it easier to influence how and if these methods are leveraged.
For L&D functions that aren’t yet included in those discussions, we strongly recommend finding a way to be included. One leader we spoke to invited himself to important meetings about talent. Another used her influence to build relationships with her peers in other HR practices so that these methods could be included in the overall development strategy.
Real-world thread: Enabling employees to experiment through job rotations
The L&D function at Boston-based software company PTC is a strong proponent of job rotations to develop employee skills.
PTC’s early-in-career rotational program, which moves junior employees through various business functions over the course of 2 years, has been highly successful, with 100% retention of employees who participate. Similarly, the HR function rotates employees across the various HR teams.
These programs offer 2 main benefits. First, employees get to practice new skills in real work environments, giving them context for the things they’re learning. Second, PTC is building a more agile and resilient workforce by developing employees with transferable, cross-functional skills.
Kelly Rider, CLO at PTC, said:
"We’re more agile now because we can say, for example, 'Oh, this person has skills in recruiting. Let’s pull them over to this project that needs those skills.'" – Kelly Rider, CLO, PTC7
As leaders consider which methods to invest in and how to message their decisions to managers and employees, it’s worth remembering that these on-the-job experimentation methods benefit both employees and the entire org.

Figure 8: Methods for connecting to learn from each other | Source: RedThread Research, 2021
Helping employees Connect with each other for learning
Also known as “social learning,” methods that connect employees to each other for purposes of sharing knowledge and developing skills are already in many L&D functions’ quivers. L&D functions have long been interested in these methods and have tried to codify and formalize them for years.
Tech platforms have been developed to aid in this socialization, but connections often happen more organically: one employee asks her colleague how to do something; other employees attend conferences together, tend to their social media channels, or seek out a mentor.
The L&D function’s role in helping people connect has as much to do with building cultures that encourage sharing as it does with formal processes or tech. For example, coaching has seen a revival in recent years, and is an important formal way to help people connect for learning. Equally important is normalizing virtual collaboration channels, such as Teams or Slack, as ways to collect and share information that could be useful more broadly.
As with some methods for experimentation, L&D functions often do not own a lot of the methods that enable employees to connect. Rather than trying to control these efforts, we’re seeing L&D functions reach out, partner with other functions, and focus on convening people and amplifying what’s good.
The L&D function can help people connect by focusing on convening people, amplifying what’s good, and creating a culture that encourages connection.
For example, a handful of leaders in different orgs gave us the specific example of mentoring programs. Rather than creating mentoring programs themselves, they’re codifying and sharing info about what’s working in some pockets of the org so people who are interested in starting mentoring programs in other areas don’t have to reinvent the wheel.
Interestingly, as the pandemic forced many employees into their homes and away from face-to-face work interactions, the value of true human connection skyrocketed.8 This theme showed up as strongly in learning methods as it did in other areas of work: in the roundtable we held as part of this research, a significant portion of the discussion was dedicated to how L&D functions can invest in learning methods that foster meaningful connections between employees.9
Methods that help employees connect for learning fall into 3 categories (shown in Figure 8):
- Connecting 1:1
- Connecting groups
- Connecting to the outside
Let’s discuss these categories in more detail.
Connecting 1:1
It’s not surprising that employees connect 1:1 to learn—one of the easiest ways to find something out at work is to walk down the hall and ask a colleague (or, these days, send them a Slack or Teams chat). It’s hard to beat the level of personalization and contextualization that comes with a 1:1 conversation with someone who’s been there, done that.
L&D functions have some options when it comes to connecting people 1:1. The methods we ran across in this study include:
- Coaching
- Mentoring
- Leader as teacher
- Expert directories
All of these methods can happen with or without the involvement of the L&D function. Many employees find their own coaches, mentors, and experts who can help them develop the knowledge and skills they need for their career.
For years, L&D functions have tried to provide a more systematic and scalable approach to these methods to ensure that those who need or want this type of experience get it. This is increasingly important as orgs are being scrutinized by their boards and by the public for their efforts to provide equitable access to development opportunities and advancement.
Recently, there has been an uptick in the use of these methods, particularly coaching. Orgs have many creative ways to scale these 1:1 connections. You can read about them in the final report of our recent coaching study.10
Connecting groups
As orgs adopt more team-oriented workstyles and compensate and judge team performance accordingly, it makes sense that employees would also connect more as groups for learning. Methods for connecting groups for learning that we identified from our research include:
- Employee resource groups (ERGs)
- Communities of practice
- Virtual collaboration (Slack, Teams, etc.)
- Team coaching / training
- Knowledge sessions (e.g., brown bag lunches)
- Book clubs
- Discussion forums
While L&D functions may not have direct responsibility for all the methods listed above, they can either influence their usage or leverage them for learning purposes.
Group-based development both fosters human connection and enables employees to practice new skills with the people they'll be using those skills with on the job.
L&D functions likely own methods like team coaching and knowledge sessions and can therefore structure them in ways most beneficial to the learning goals of the org. Leaders said they’re experimenting more and more with group-based development because it does 2 things at once: it fosters human connection among group members and enables employees to practice new skills with the people they’ll be using those skills with on the job.
L&D functions may not be the sole owner of ERGs and communities of practice, but they can influence them by helping to craft charters and training leaders, and they can leverage them to develop necessary skills and awareness in those taking part—DEIB awareness or wellness, for example. Participants can also be tapped to help L&D functions understand where the development needs are and, in some cases, help develop the content.
One learning leader told us that convening groups across the org is a key way his team supports connection at scale. His org has a strong culture of building communities of practice that connect people across disciplines to share templates, best practices, and insights.11 The central learning team leverages this culture (remember that trend of building on what already exists?) to connect groups for learning.
Connecting to the outside
Finally, orgs use methods that connect employees to people and ideas outside of their own walls. This category focuses on ensuring employees have the external connections they need to be successful, both in their current roles and in their long-term careers. With so much change in almost every industry and function, both orgs and employees benefit when people are able to forge connections outside the org. The methods in this category include:
- Industry conferences
- Professional organizations
- Professional / personal networks
While these methods are sometimes seen as the responsibility of the individual employee, we think that L&D functions should invest to enable them, as they yield pretty large benefits to orgs:
Development opportunities
It’s a (true) cliché that who you know influences what jobs you get; it’s also true that who you know influences the development opportunities you’re able to secure. Our research earlier this year on skills and internal mobility both revealed that employees’ personal and professional networks strongly influence the opportunities they find out about and have access to.12 Enabling all employees to build these relationships is a critical task for L&D functions.
While methods to bring the outside in may often be seen as the responsibility of employees, we think orgs should invest in them because they benefit the org, too.
Bringing outside info in
We’ve worked with a number of orgs this year who’ve talked about the need to “look up and around”—to stay current on trends, leading thinking, and leading practices in a fast-changing environment. Enabling employees to connect to the outside is one way to do this.
Developing interpersonal and networking skills
Networking is an increasingly important skill. Because one person cannot know everything, orgs should enable employees to know the people who know all the things. Conferences, professional organizations, and building professional and personal networks are key. In some industries, such as consulting or sales or politics, a good network is crucial to good performance.
Real-world thread: Supporting employees to connect for learning
We mentioned above that orgs are finding lots of ways to systematize and scale 1:1 connections. One way they’re doing this is by focusing on sharing info, providing guidance that applies to the whole org, and highlighting leading practices.
An org that’s doing this well is a large US insurance company which supports a variety of mentoring initiatives. The central L&D team understands that in an org of 60,000 employees, different business areas have different ways of doing things and that sometimes employees find mentoring opportunities on their own—and that’s a good thing.
Kaitlyn M., formerly a learning leader at this company, said:
“Mentoring happens in the community, at centers of worship, at connections from other companies. Those aren’t things our company can control, nor should we." – Kaitlyn M., former learning leader, large US insurance company
Accordingly, the central L&D team focuses on providing enterprise-wide guidance and sharing leading practices about mentoring in the company. They disseminate answers to questions like:
- What’s cutting-edge in mentoring?
- What’s the definition of mentoring at State Farm?
- What are the qualities of a good mentor?
- How long should mentoring relationships last?
The central L&D team intentionally looks for answers to these questions inside as well as outside the org. An analyst on the L&D team does research within the org to identify which groups are doing mentoring well. The team then works to formalize and scale these leading practices as enterprise guidance.13
Focusing on org-wide guidance and sharing what’s already working strikes us as a highly effective and efficient way of fostering connections at scale.

Figure 9: Methods for performing | Source: RedThread Research, 2021
Helping employees Perform better on the job
L&D functions should be helping employees learn on the job and perform better while doing it. Performance support has long been part of the L&D repertoire—think standard operating procedures and other methods that attempt to make task performance as predictable and standardized as possible. But there’s more to it than that.
We’re seeing new ways of enabling learning-while-performing in 3 key areas:
Pushing data down
More orgs are enabling employees to access data about their own learning and performance. Data, such as customer feedback, sales numbers, performance reviews, and learning strengths are shared with managers and the employees themselves because orgs are recognizing that the employee is the person best equipped and most motivated to act upon it.
Leveraging employee knowledge
In keeping with the trend toward user-generated content, leaders said they’ve started to invite employees to take a more active role in creating and updating documents related to performance support (such as job aids).
Culture of feedback
Historically, feedback has been given from manager to employee, and in some rare, formal cases, from employee to manager via 360 (or formal complaint to the HR department). However, many orgs are actively looking for ways to make feedback a part of the culture. More on this below.
Orgs are experimenting with learning methods that push performance data down to the individual—the person best equipped and most motivated to do something with it.
Methods that enable employees to perform better on the job and learn while doing it fall into 3 categories (shown in figure 9):
- Instructions
- Collaboration spaces
- Feedback
Let’s discuss these categories in more detail.
Instructions
For about a century, one of L&D’s primary roles has been to help employees perform certain tasks as similarly as possible. Efficiency, standardization, and predictability were the name of the game—think manufacturing. The instructions category reflects that history, and is all about providing employees with detailed descriptions of how to perform critical tasks in their role. Methods in this category include:
- Job aids
- Standard operating procedures
- Job safety analysis
But there have been some exciting developments in recent years, moving these established methods into the 21st century. Newer approaches to these methods include ways to involve employees in creating and updating the information. People who have done the job are often responsible for updating the documents, reflecting a belief that learning doesn’t need to be prescriptive or from a centralized source—it can be more helpful “from the horse’s mouth.”
Collaboration spaces
If the instructions category is fairly set—“this is how this job is done”—then methods in the collaboration spaces category are more fluid. They’re about creating places for employees to share their knowledge on a topic, update that knowledge as needed, and easily access the knowledge from inside their work. These methods work best, of course, when they’re well-organized or easily searchable so people can find what they’re looking for.
Methods in this category include:
- Wikis
- Shared files
In many cases, L&D functions do not own the sources of information for these methods: someone closer to the work does. L&D’s role therefore becomes about providing visibility and accessibility to content, not necessarily creating or monitoring that content.
Because they don’t own the sources or the content, L&D functions often need to work with other HR functions or the business function to make sure employees have the needed visibility and access.
Feedback
Learning methods in the feedback category give concrete and actionable information to employees about how they’re doing and how they can improve. This is one of our favorite categories, since it can so strongly enable a learning culture.
Feedback gives concrete and actionable information to employees about how they're doing and how they can improve.
Methods in this category include:
- After-action reviews
- Performance statistics (e.g., sales revenue)
- Feedback from customers, managers, and peers
L&D functions often hit this category indirectly: they don’t have direct control over the feedback people give one another, but can influence how those people learn (e.g., they can’t determine if managers are going to provide feedback, but they are responsible for what managers learn) about when and how to give good feedback. They also can help employees seek feedback, which just makes the situation better all around.
Feedback can be tech enabled or not. On the tech-enabled end of the spectrum, a lot can be done by putting actionable data directly into employees’ hands. For example, one vendor we talked with showed us their tech platform, which sends customer ratings and reviews to call center reps within minutes of a service call—allowing the employee to adjust efforts in time for the very next call.
On the less tech-enabled end of the spectrum, we’ve heard a lot about working with other functions to build feedback into processes, as in the after-action review example below.
Real-world thread: Creating a culture of feedback
An L&D function can’t create a culture of feedback alone. But they can influence the culture by working with other functions to implement systems and processes that make feedback part of the way business is done.
The US Navy SEALs have embedded feedback deeply into their culture, partly through the use of their famous After-Action Reviews (AARs). In an AAR, all members of a SEAL team gather immediately after a mission or training session to break down the event in detail. They ask:
- What went wrong?
- What did each person do, and why did they do it?
- What will we do differently next time?
The candid feedback team members deliver to one another in AARs is often uncomfortable, but it’s considered an essential part of how the team gets better.14
We’ve implemented AARs in our teams at RedThread and have found enormous benefit in the structured ways they help us learn from mistakes and improve our work. We’d encourage leaders to consider this and other methods of embedding feedback—first in the L&D function itself and moving out from there.
All the methods
There you have it: The dozens of learning methods we’ve found, the categories they fall into, and the 6 behaviors they can enable (Plan, Discover, Consume, Experiment, Connect, and Perform). It’s a lot—a lot of methods, and a lot of ways they can each be used.
Not all orgs need all learning methods, of course. But L&D functions do need to think about whether they are appropriately supporting each behavior, and whether they have the right mix of methods to enable their employees to build the skills that serve the org’s strategy.
One learning leader, whose team focuses on enabling external customer learning, described her org’s thought process this way:
“We think about the customer’s learning journey and the different methods that are required at every single point. What methods drive discoverability? Adoption? And so on.” – Sonia Malik, Learning Alliances Manager, IBM15
With a clearer understanding of what learning methods are available and how the Employee Development Framework can be used to conceptually organize those methods, let’s turn to the question of what methods might be best for your org—and how to decide.
The right methods in the right combinations
So far, we have reviewed the Employee Development Framework and identified several dozen learning methods that can enable each of its behaviors. Just having a (fairly) comprehensive list of learning methods can help L&D functions begin to think beyond the course and introduce, recognize, or support other ways of learning in the org.
However, as most L&D leaders understand, having information and knowing what to do with it are 2 different things. In our conversations, we heard of 5 innovative ways leaders are deciding which methods work best for their orgs:
- Understand the messages your methods send
- Experiment, iterate, push boundaries
- Design bike paths, not buses
- Squirrel!: Don’t get distracted
- Let go of what’s not working
Note that none of these 5 approaches indicates a one-and-done decision. Instead, “deciding” on the right learning methods in the right combinations is an ongoing process of experimentation and improvement, trial and error.
Deciding on the right learning methods is an ongoing process of experimentation and iteration.
Let’s look at each of the 5 approaches to deciding on learning methods in more detail.
Understand the messages your methods send
We heard a consistent refrain from leaders in this research: know your audience. We’d expand this sentiment to: know your culture, and know the culture you want to create. The decisions L&D functions make about learning methods strongly shape how learning happens in the org. That means those decisions need to both fit the current ways learning happens and nudge the org in the direction of the learning culture your org wants to have (or further in that direction, if you’re already on the way).
For example, a business services org we have worked with was heavily relationship-oriented. That feature was a strength of the culture, and one the L&D function wanted to support and enhance. Instead of drowning their employees in a sea of e-learning courses, they focused on events, both live and virtual, coaching, and using leaders as teachers.
When it comes to deciding on learning methods, the saying, “actions speak louder than words” is true. L&D leaders should think carefully about what their learning methods “say” to the org, because those messages help nudge the org toward or away from the culture the org wants to create.
Here are a few examples of intentional or unintentional messages sent by chosen learning methods.
Mandatory individual development plans
An org that institutes individual development plans (IDPs) for all employees and makes them easy to access and linked to learning opportunities and performance data might send the message that, “We continuously develop at this company. We want and expect you to develop while you’re here.”
Locked-down courses
Many orgs have some development opportunities that are limited to certain groups or types of employees. Making those opportunities visible to all, but available to only a few, might send the message that, “This opportunity is only for special people (and you’re not special).”
Coaching for all
An org that actively implements various types of coaching, at least some of which are open to all employees, might send the message that, “We are investing in you. We care about everyone’s development, including yours.”
Job rotations
Orgs that implement job rotation programs and market them widely internally (as opposed to programs that exist but remain largely unknown and unused) might send the message that, “Mobility is important to us. It’s important for you to get exposure to other areas of the org.”
Orgs that invest in sending employees to conferences on a regular basis might send the message that, “We’re interested in your gaining outside perspectives.” Orgs that also encourage employees to present at conferences send the message that, “We want you to be seen as an expert in this area.”
After-action reviews
Orgs that use after-action reviews as a part of how they operate might send the message that, “We learn from our mistakes.”
These are just a few of the potential messages these learning methods might send. Bear in mind that whatever methods you decide on are going to send a message. We encourage leaders to think carefully about what those messages might be and whether they will nudge the org in the direction you want.
Experiment, iterate, and push boundaries
Given how traditionally many L&D functions say they operate, we were pleasantly surprised at the extent to which leaders said they take an iterative approach to learning methods. They try new methods, or new approaches to existing methods. They see what works and improve over time.
This iteration mindset—and it is a mindset—takes conscious effort to embed into the org. Leaders said they make a point to celebrate failures as well as successes, highlighting failures as opportunities for learning. They also work hard to build a sense of community and psychological safety so that all L&D team members feel encouraged to try new things.
Leaders should experiment, see what works, assess what doesn’t, and improve over time.
Another way leaders encourage experimentation and iteration within the L&D function is by thinking about learning as a product. They think in terms of a product development cycle: discovery / understanding needs, developing a minimum viable product, piloting and testing, and so on.
And like good product developers, the L&D function shouldn’t be just an order-taker that simply caters to the current needs and desires of employees or other business functions. Instead, L&D functions have a responsibility to help the org and its employees continually develop. That sometimes means gently helping people step outside their comfort zones by painting a picture of what the future might look like and how they will benefit from that future.
Leaders in this area also obsessively use data and feedback to inform experiments. One leader placed trackers on different pages in a new learning portal and used A/B testing to see which pages were most effective. Others pay close attention to the comments and reviews from employees in their learning systems and adjust based on that feedback.
Real-world thread: Pushing boundaries
L&D leaders can use data to push boundaries. At a Fortune 100 manufacturing org, a new method for cybersecurity training was making some people uncomfortable. The L&D function was able to use data to help people see that it was working.
In early 2021, the central L&D team paired with the IT group’s cybersecurity team and business functions to launch a cybersecurity training. The training sent mock phishing emails to employees, tracked how they handled the mock emails, and recommended follow-on training opportunities in the L&D org’s learning tech platform. The learning tech platform also captured employee comments on the training.
After sending the mock emails, the IT group received about 30 emails (including from one very senior leader) criticizing the training. However, the mock email campaign also received about 300 positive comments in the learning tech platform, and many leaders began sharing the recommended training with their teams.
The central L&D team was able to look at the data and fully contextualize those 30 criticisms against everything else that was going on.
The CLO said:
“All this goodness was happening, and we were able to package all the data to show the full picture to our partners in IT and our senior leaders. That was an early example of not freaking out about something new because we had the data to show it was working." – CLO, Fortune 100 manufacturing org16
This focus on data and feedback can help make the case for new approaches that might otherwise be overcome by org inertia or resistance.
Design bike paths, not buses
We love the following analogy from Eric Dingler, CLO, Deloitte US. Eric shared this analogy to illustrate how L&D functions have historically used inflexible, course-focused learning methods:
“L&D is great at designing buses. We need to get better at designing bicycle paths. Not 1 million paths, sure, but a lot more than 1 per year per level.” – Eric Dingler, CLO, Deloitte US17
Buses accommodate a big group of people but are inflexible in their seating, their route, their destination, and their stops. They’re designed to efficiently get a number of people with the same general need to a place relatively close to their final destination.
Bike paths, on the other hand, may lead to the same destination, but accommodate slower riders or professional cyclists, those out for a Sunday roll or those in a race. People can ride together, but don’t have to. Parents can teach kids to ride on their own along the way. Everyone can stop for some ice cream, and some can even get off the path for a while.
Eric is in favor of methods that act more like bike paths. At Deloitte, he and his team are building learning opportunities that are more flexible and therefore easier for each individual employee to use in ways that work for them: employees can jump on a path whenever they want, proceed at their own pace, and jump off when they’re at their “destination” or need a break.
Note that the analogy doesn’t imply pure chaos or lack of structure. Indeed, L&D functions should still provide a lot of structure to ensure employees get where they need to go. The key seems to be creating systems that allow for flexibility within that structure.
We heard similar sentiments from other leaders when describing their attempts to enable flexibility within structure. One put it this way:
"It’s necessary to provide enough structure so that experimentation happens organically. So that it feels easy and effortless." – Ryan Cozens, L&D Lead, Well Health18
This type of flexibility benefits more than just the employee. Orgs using “bike paths” can respond more quickly to disruption—changes in strategy or worldwide pandemics, say. They also have more data because they have more employee touch points and can therefore better understand what skills they have and where they should focus their development efforts. And they can more easily experiment with new methods and change things that aren’t working without a huge investment of effort, time, or money.
How are leaders going about building flexibility within structure? The exact approaches vary from company to company, but 3 common themes emerged.
Modularity
If flexibility is the goal, then it makes sense to make learning opportunities more modular so they can be switched around, combined, or removed as needed. This movement toward modularity applies to learning content, sure, but also to the ways learning opportunities are pieced together.
For example, if an org wants all employees to have data analytics as a skill, traditionally they might have sent all employees through the same course. However, if they’re thinking in terms of modularity, they may combine many learning methods to meet the employees wherever they are.
A financial analyst may just need to verify that she already has the necessary skills. An engineer may find he needs a few refresher videos and a practice exercise. And an artist may discover that she benefits from all of the modularized videos, all of the practice assignments, and verification that she has the necessary skill.
Integrated with the work
Leaders also told us that they were trying to integrate the learning with the work as much as possible. This meant different things to different leaders. Those new to the idea focused on “bite-sized” bits of learning that could be easily integrated. Those with more experience were utilizing methods in Experiment, Perform, and Connect, specifically, to use the work as much as possible as the main learning tool.
Skills-based
Most of the leaders we talked to are adopting a skills-based approach to learning methods. The granularity of skills makes it much easier to assemble, break down, and reassemble learning methods, and to set up “create-your-own-journey” learning paths for employees. L&D’s role in this case is to clearly tie methods and content to skills, and to provide assembly instructions for those building their own paths.
Squirrel!: Don’t get distracted
From both the roundtable and our interviews, leaders told us that the first criterion for selecting learning methods should be that the development helps to solve a business challenge. We love this, and we absolutely think it should be applied to learning method decisions.
Knowing the L&D space like we do, and also understanding L&D’s propensity for research and love of tech, we want to point out an obvious but maybe painful truth about this group: we like shiny things. We like new, and we’re constantly looking for things that can help us do what we do (and therefore help employees do what they do) better / faster / shinier.
That said, the well-grounded leaders in our roundtable pointed out that the methods you select should solve a challenge the org is having. While methods don’t tie directly to business challenges (you can use several to solve the same challenge), we agree that a focus on the org, not just the employees and their experience, is key when choosing methods.
The methods you select should solve a challenge the org is having. A focus on the org, not just employees and their experience, is key.
In this study, leaders mentioned 3 questions they ask themselves when considering a new method for their org to keep themselves from getting distracted.
Does the method make financial sense?
There are lots of sexy learning methods out there, and all of them cost money. Leaders spoke not just of finding the budget or justifying the cost, but actually analyzing the method financially to determine whether it made sense for the problem it was meant to solve, including internal resources that will be needed to implement, coordinate, and service it.
Does the method work for the intended audience?
We heard a lot from leaders about the need to know your audience. They ask questions like: Are the methods likely to achieve the goal, given the audience’s needs and preferences? For example, the needs and constraints of an office worker are quite different than the needs and constraints of a manufacturing supervisor. Understanding those differences and choosing methods that work well for them is pretty important when enabling their development.
Does the method work with your org’s tech stacks?
Finally, leaders talked about their org’s tech stack—both leveraging what is currently there and implementing new methods with tech components. Two areas they mentioned specifically were user experience (did this align with what learning meant in the org?) and data (how would this data be passed to other tech or stored in a data lake?).
If the answer was yes to all of these questions, leaders were more comfortable implementing—or even just experimenting with—the method in question.
Let go of what’s not working
Leaders told us that the first thing to do when a method isn’t working is to figure out why. Sometimes a quick tweak, more communication, or better visibility can increase engagement and value to the org. Sometimes it can’t. Sometimes you have to let things die. And sometimes you have to cut them loose.
Saying goodbye
Letting things die is often a challenge for L&D functions. Candidly, there’s an emotional aspect to letting go. L&D teams often work hard to create learning methods that are often successful for a time. Or they work hard on things that just flop. In either case, there can be natural resistance to letting go of methods that no longer work. But as one leader said:
"The world is changing. Don’t get attached to a learning method. If it works, great. If not, move on and find something that works better." – Jeffrey Mills, Manager, Org Learning & Development, QSC19
More tactically, the leaders we spoke with revealed 3 enlightening ways to make it easier for their L&D functions and L&D professionals to let go of what’s not working.
Make methods disposable
Some leaders consider all learning methods as disposable or having a short shelf life. Everything has a life cycle, they said, which means it’s natural for things that no longer work to be pulled out of the system.
This is akin to hand-making valentines. You put a lot of effort in them to benefit someone, but you know they’re likely going to appreciate it (or not) and then toss it on February 15. By having a mindset of disposability, L&D leaders and their teams can make more rational decisions about what to invest in and what not to invest in, both originally and on an ongoing basis.
Implement the strategic pause
Sometimes it can help to simply put time and distance between the realization that something isn’t working and the final act of letting go. One leader said:
“If something isn’t working, we’ll do a ‘strategic pause.’ We stop providing the program and evaluate if it’s really needed. If so, we rework the offering. If not, we find a way to offboard it."
– Roundtable participant, Oct 2021.”20
Delegate the decision to the business function
In orgs that use a charge-back system (business functions contract with a central L&D function to create a learning initiative), L&D leaders can leave the keep / toss decision to the business function. If a program or a piece of content continues to be useful, the business function keeps it alive. If not, they let it go.
Cutting them loose
In some instances, L&D functions may take a more proactive approach to getting rid of learning methods. In such cases, the cutting-loose is planned as a part of the method’s implementation. Orgs focusing on skills, for example, understand that the learning methods, the data, and the tech associated with teaching skills that they’re using in this moment are not the ones they will be using in 3 years—and maybe not even in 6 months.
Tech, data, and methods continue to get better. So rather than just thinking of certain methods as disposable, it’s important to make them disposable. One leader mentioned 2 main ideas.
First, contracts with vendors of all sorts should get shorter. Large learning tech implementations are sometimes 10 years long, which gives plenty of time to implement the tech, work out the bugs, see the benefits, and then ride the wave for a while. However, if your org knows it will be jumping to something better as soon as it’s available, contracts need to be negotiated with shorter terms.
Building an exit strategy into the implementation of learning methods ensures that they won't outstay their welcome.
Second, there has to be an exit strategy. As learning tech gets more sophisticated, it becomes more integrated into an org’s tech stack, and more data flows into and out of the system. When an org plans to kill a method or tech, it needs a plan in place for what happens with those integrations and, even more importantly, that data.
We love the idea of building an exit strategy into the implementation of learning methods. Although it doesn’t apply to all methods, it ensures that when it’s critical, methods won’t outstay their welcome.
Real-world thread: Letting go of what’s not working
When it becomes clear that a learning method isn’t working, the right course of action is sometimes to ditch it in favor of something that does work.
That’s what happened at NASCO, a healthcare tech company. A customer-facing learning program initially created a full user guide to help customers use a NASCO product. As the Workforce Readiness Solutions team watched customer usage, they realized customers weren’t using the guide. Instead, customers were capturing video snippets and using them to train employees on the product.
The NASCO team used that data to adjust their efforts. They started releasing short video snippets, eventually replacing the full user guide with video snippets as a part of the customer’s knowledge management solution.
We loved NASCO’s willingness to let go of a product they’d devoted a lot of time to, and pivot to ensure their learning methods were as useful to their customers as possible.21
Wrapping up
Although most of the learning methods we’ve covered in this report have been around for a while, the ways they’re being used in many orgs are quite innovative. The 6 behaviors in the Employee Development Framework offer a way to understand what learning methods are available and how they can be used to enable different learning behaviors—making it easier to assess whether an org has the right methods, in the right combinations, for their goals.
We expect to see more orgs taking a broader approach to learning methods in the future, because leaders see the value in the flexibility and personalization such approaches offer in a changing business climate. We look forward to seeing how that approach works and continues to evolve.
Appendix 1: Methodology
We launched our study in the fall of 2021. This report gathers and synthesizes findings from our research efforts, which include:
- A review of 60+ articles, podcasts, videos, and books from business, trade, and popular literature sources
- 1 roundtable with 28 participants
- 15 in-depth interviews with leaders on learning methods
For those looking for more info on this topic, you’re in luck: We have a policy of sharing as much information as possible throughout the research process. Please see these articles on our website:
- Premise: Choosing the right development opportunities for your employees
- Next-Gen Learning Methods: Literature Insights
- Roundtable readout: Choosing, evaluating, and offboarding learning methods
Appendix 2: Contributors
Thank you so much to those of you who participated in our roundtable and interviews. We couldn’t have done this research without you! In addition to the leaders listed below, there are many others we can’t name publicly. We extend our gratitude nonetheless: You know who you are.
- Adrian Klemme
- Alison Antolak
- Ann Boldt
- Brian Richardson
- Buck Seward
- Dan Balzer
- Deanna Foster
- Doug Osborn
- Eric Dingler
- Erik Soerhaug
- Jeffrey Mills
- Jim Maddock
- John Fallon
- Kaitlyn Mathews
- Kate Earle
- Kelly Rider
- Kim Ziprik
- Lisa Ross
- Rachel Hutchinson
- Ryan Cozens
- Sonia Malik
- Stephen Wilhite
- Stephen Young
- Zachary Pfau
In addition, we thank Ferenc Laszlo Petho for graphic design and Jenny Barandich for layout.

Unlocking the Hidden C-Suite Superpower: People Analytics
Posted on Tuesday, November 9th, 2021 at 11:20 AM
Agendas for boards and CEOs have never been so crowded with talent-related topics—workforce strategies and wellbeing; diversity, equity, inclusion, and belonging (DEIB); culture; and, corporate purpose.
Traditionally, many leaders made people decisions based on anecdotal conversations with employees and their guts. The COVID-19 pandemic has shown that this kind of approach can no longer work.
People data-based insights will help C-suite leaders manage their companies more effectively. The question, though, is: What is the role of C-suite leaders in enabling and using those insights? And what can CHROs and PA leaders do to help C-suite leaders leverage people analytics to make better decisions?
With this report, we explore:
- What types of behaviors, approaches, and questions should C-suite leaders use to get better people-related insights?
- What types of behaviors, approaches, and insights should CHROs and people analytics use to support C-suite leaders?
- What types of results might leaders expect of effectively integrating people insights into critical business decisions?
The report includes a wealth of examples, useful insights from practitioners, and lists of do's and don'ts for C-suite, CHRO, and people analytics leaders.
This study is a culmination of 6 months of qualitative research which involved a literature review of more than 60 articles, interviews and conversations with more than 30 people.
Click image below for download.
Quick Summary: People Analytics for the C-Suite
Posted on Tuesday, November 9th, 2021 at 10:00 AM
People data-based insights can help C-suite leaders manage their companies more effectively. The question, though, is: What is the role of C-suite leaders in enabling and using those insights? And what can CHROs and PA leaders do to help C-suite leaders leverage people analytics to make better decisions? We have tried to answer these questions, and more, through our recent study on people analytics and the C-suite.
This infographic (click on the image below to get the full version) highlights key insights from our report Unlocking the Hidden C-Suite Superpower: People Analytics.
As always, we’d love your feedback at [email protected]!

The Employee Engagement & Experience Market: An Update on “Workday Peakon Employee Voice”
Posted on Monday, November 8th, 2021 at 12:01 PM
Today Workday provided an update on its acquisition of Peakon, now called “Workday Peakon Employee Voice,” roughly six months since the deal closed. Before getting into the details of this update, we’re going to provide some context on the employee engagement and experience market. We’ll then turn to the goals of the acquisition and what we can tell so far about how well Workday Peakon Employee Voice is meeting those goals.
The Employee Engagement & Experience Market
Growing Rapidly
As we wrote earlier this year, employee engagement and experience technology has been a lifeline for leaders hampered by work from home and unable to interact directly with their employees. It enabled leaders to keep a check on employee pulse throughout the pandemic, especially as fatigue, burnout, and stress levels have all boomed. It has also helped leaders to understand changing perceptions of return to office plans and adjust at a much faster velocity than ever before. Further, leaders are increasingly using these solutions to better understand diversity, equity, inclusion, and belonging (DEIB) within their organizations.
The pandemic did not create the employee engagement and experience market – it was going full steam ahead before March 2020. However, the events of 2020 turned that steam into rocket fuel. As a result, the employee engagement and experience market was one of the fastest growing people analytics tech segments in 2020, and when we complete our study of 2021, we expect it to be THE fastest growing segment. Further, we believe that growth will continue well into the future, as senior leaders have just begun to really grasp the power of people data.
Quite Crowded and Complex
Yet, the employee engagement (eng) and experience (exp) market is quite crowded and complex, especially when you consider all of the vendors who have added employee engagement to their core offerings. For example, let’s take 4 areas we’ve seen converging for the last 3 years or so:
- Employee engagement / experience
- Performance management
- Recognition
- People data integration
When you look at the intersecting points of all these areas and vendors, you get a chart that looks like Figure 1. There are approximately 30 vendors by our count in the employee engagement or experience market, and we are certain there are more than we have on this chart (if you’re one of them, feel free to email us at [email protected], and we will get you on our list).
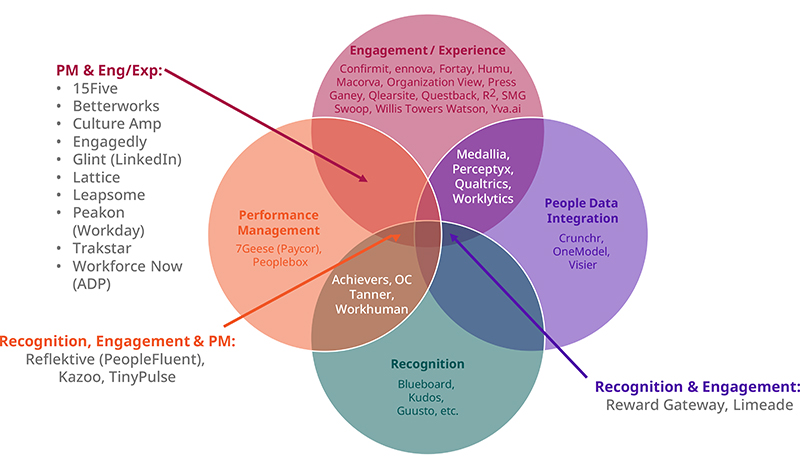
Figure 1: Vendors in the Engagement / Experience, Performance Management, Recognition, and People Data Integration Spaces | RedThread Research, 2021.
We are seeing so much overlap because vendors and customers realize that it is no longer realistic to keep these concepts separate. How do you understand engagement without also understanding performance feedback? And how do you give performance feedback without also giving recognition? And how do you understand any of this without solid people analytics?
As a result, we are seeing a need for significant data integration – which is leading to interesting data partnerships, such as the People Intelligence Alliance, as well as acquisitions.
And Very Acquisitive
And there have been lots of acquisitions – and on multiple levels. For example, there have been acquisitions where somewhat larger engagement / experience or performance providers bought each other, such as:
- Culture Amp (Eng/Exp) purchased Zugata (PM) in 2019
- Betterworks (PM) purchased Hyphen (Eng/Exp) in 2020
- Perceptyx (Eng/Exp) purchased Waggl (Eng/Exp) in 2021
- LTG / People Fluent (Core HR, Learning, etc.) purchased Reflektive (PM and Eng/Exp) in 2021
Many of these vendors bought their smaller counterparts so as to expand their feature set, acquire new customers, increase engineering capabilities, etc.
But we’ve also seen the much bigger HR Tech vendors buying best-of-breed engagement / experience solutions, such as:
- Microsoft purchased LinkedIn / Glint in 2018
- SAP purchased Qualtrics (2018), then sold it in 2021, but maintained a majority ownership stake
- Workday purchased Peakon in 2021
These bigger vendors’ reasons for purchasing employee engagement and experience platforms were different: it was a customer value and data play. They were looking to do three things:
- Provide a high-quality engagement / experience solution for customers
- Create or round-out their offerings in the four areas highlighted above
- Integrate data from these different talent areas more smoothly
Given those three goals, how is Workday’s acquisition of Peakon going, 6 months in?
The Integrated Product: Workday Peakon Employee Voice
As we wrote in the acquisition blog, we think this purchase made a lot of sense. In short, it filled a hole in capability for Workday, Peakon is a solid product, and there was strong cultural alignment between the two orgs. Let’s talk though, about how this acquisition is performing, given the goals mentioned immediately above.
Goal 1: High Quality Engagement Solution
The new, integrated product, Workday Peakon Employee Voice, appears to be following Peakon’s pre-acquisition trend of delivering strong customer value. Customers are using the solution to take insights on topics such as engagement, diversity, equity, inclusion, and belonging (DEIB), and health and wellness and turn them into action through conversations, personal dashboards, team collaboration, and contextual learning resources.
Customers are rewarding Workday Peakon for the offering, as indicated by:
- Commercial success of the new product has been significant, with Peakon experiencing a dramatic acceleration of its business
- Growth has come from new Peakon customers as well as existing Workday customers
In addition, according to Workday, early customer feedback has focused on the ease of use of the platform, the ability for employees to provide feedback easily to leaders, and the use of natural language processing (NLP) to classify comments more easily (especially as positive, neutral, or negative) so they can respond much faster.
Workday is selling the product within its larger suite of products as well as a separate SKU. This is important, because it means that customers outside the Workday HCM ecosystem can still buy it.
Given all the above, it appears the acquisition is very much so meeting this goal.
Goal 2: Round Out Talent Offerings
As mentioned above, a second reason many of these large HR tech providers bought the smaller engagement / performance management vendors was to round out their overall talent offerings.
Peakon clearly ticks this box when it comes to employee engagement and experience (as discussed immediately above). What’s not yet totally clear, though, is the extent to which it does the same for the performance management offering.
Workday’s current performance management offering could use some improvement, especially when it comes to serving more agile performance management approaches. Prior to acquisition, Peakon offered Grow, which was its performance management solution targeted at organizations leveraging a more agile approach. This product is still available to customers, so in this way Workday ticks this box.
However, Grow is not yet integrated into the broader HCM suite in the same way as Workday Peakon Employee Voice. This means that Grow and the existing Workday performance management solution do not talk to each other yet. As a result, there isn’t really a way for existing Workday performance management customers to seamlessly adopt the agile approach offered by Grow.
Workday indicated performance management is a high area of interest and they plan to continue building out the capabilities of Grow and to integrate them into their standard performance review capability. We don’t yet have a timeline yet on when that might happen, though.
Goal 3: Integrated Data
The opportunity to integrate Peakon and Workday data together is one of the most exciting aspects of this acquisition – and one Workday is working on now.
As many of you know, Workday offers its VIBETM Index (VIBE stands for Value Inclusion, Belonging, and Equity), which provides insights on a wide variety of diversity characteristics in the following areas:
- Hires
- Promotions
- Leadership
- Belonging
- Attrition
Yet, VIBE only has insights on the current state and how it compares to benchmarks – it gives little insight into how an organization got to that point.
This is where Peakon’s insights – specifically from its Include product – come in. Workday is integrating Workday Peakon Employee Voice insights into the VIBETM Index, so that leaders will be able to both see what is happening and why. You can imagine a world where, instead of just sharing stories on how representation has changed (as shown in Figure 2), the VIBETM Index could also share how key drivers of engagement or turnover have changed for a specific population, and what that might portend for the future.

D&I Tab of Workday People Analytics | Workday, 2021.

VIBE Index tab of Workday People Analytics | Workday, 2021.

VIBE Central Dashboard in Workday, available with Core HCM Subscription | Workday, 2021.
This integration of Workday Peakon Employee Voice data into VIBETM is still in process, but should be available relatively soon. Workday is also working to integrate Workday Peakon Employee Voice data into other parts of its People Analytics solution as well as into Prism, but those are not yet available.
Given all the above, we see Workday working quickly to meet this goal, though it hasn’t been fully achieved yet.
Looking to the Future
Looking forward, there are lots of other interesting ways Workday Peakon Employee Voice capabilities could be integrated into both other aspects of Workday as well as into the overall flow of work.
Our understanding is that Workday is looking to use Workday Peakon Employee Voice strategically throughout the employee experience, by asking targeted questions at specific trigger points (e.g., return to office, return from parental / care leave, 30/60/90-day milestones). The solution is currently integrated with both Microsoft Teams and Slack via the company's Workday Everywhere initiative and we image they will come up with additional ways to put the solution into the everyday flow of work.
From everything we can tell, it appears the acquisition of Peakon is going well, and we are excited to see Workday work to get these integrations – particularly data and of the performance management products – completed. By doing this, Workday will be able to realize its customer value proposition of delivering one data model and a seamless experience more fully. We look forward to continuing to hear from customers as this happens.
Quick Summary: Skills Driving DEIB
Posted on Tuesday, October 19th, 2021 at 3:27 PM
Our team has recently spent a lot of time trying to understand novel opportunities on which orgs can focus their DEIB efforts. Enter skills.
This infographic (click on the image below to get the full version) highlights key insights from our report, Creating A DEIB Culture: The Skills Every Employee Needs, through which we have tried to answer 3 questions as they relate to skills for DEIB:
- What skills contribute to DEIB, specifically in fostering diversity, enabling people to feel included, and building a culture of belonging in the workplace?
- How those skills might vary, depending on factors such as an employee’s level, role, diversity characteristics, etc.?
- What can orgs do to develop and leverage these skills, including specific approaches and modalities?
As always, we’d love your feedback at [email protected]!

Performance Management for a Hybrid Workforce: Insights & Takeaways
Posted on Tuesday, October 5th, 2021 at 9:00 AM
As part of our research on modern performance management, we invited leaders to participate in a roundtable discussion on performance management (PM) for a hybrid workforce. The conversation focused on 4 main topics:
- Goals and assessments. How should orgs amend their goal-setting and assessment processes to meet the needs of a hybrid workforce?
- Capability of managers. How can managers be supported in enabling performance for a hybrid workforce?
- Feedback. How should orgs rethink their feedback approach to meet the needs of a hybrid workforce?
- Technology. How can tech be used differently to support the measurement and enablement of employee performance for a hybrid workforce?
Grounding Our Conversation: Our Previous PM Research
To start the conversation, we shared our previous research on the topic that consisted of findings from our Fall 2019 study, Modern Performance Management, in which we identified the “3 Cs” that drive performance—culture, capability of managers, and clarity. But PM needs to change for the hybrid world. Our 3 Cs model can be leveraged and applied to managing a hybrid workforce, as shown in Figure 1.
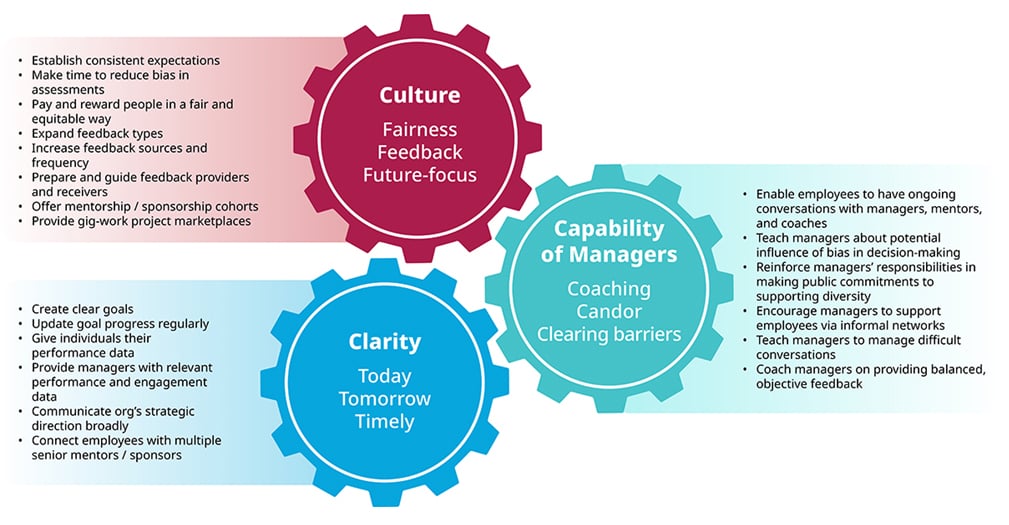
We also shared our findings from a recent extensive literature review based on more than 60 articles, blogs, and academic papers. Some of the key themes and hidden gems shared include:
- Orgs need to rethink bias and culture
- Managers tackle PM with empathy
- Recognition and rewards matter in hybrid work
- PM tracking needs to meet the ethical needs of hybrid work
- A more strategic role for HR
Key Takeaways from the Discussion
The roundtable discussion resulted in rich insights. The overall discussion focused on how current PM processes and systems can be redesigned to meet the needs of a hybrid workforce. Leaders shared their challenges and ideas around how they’re approaching the changing needs of their orgs. Some of our key takeaways from the discussion are:
- Orgs need to rethink differentiated rewards moving forward
- Leaders and managers should check for bias and intentionality when it comes to feedback
- Senior leaders and managers need to upskill to enable performance in a hybrid environment
- PM tech matters, but only if it enables those involved in performance processes
Orgs need to rethink differentiated rewards moving forward
2020 was the year during which empathy resurfaced as a crucial capability for managers and senior leaders. Some orgs put ratings on hold during the COVID-19 pandemic (to be resumed later) or completely eliminated them, as employees struggled to adapt and perform in a changed environment.
However, when talking about the future, leaders emphasized the need to adapt ratings for a hybrid workforce—and design a differentiated rewards system for high and low performers. As one leader explained:
“2020 was all hands-on deck, but at the end of the day we know some were pulling harder than others. If we do not find a way in this environment to account for that and reward people, we will run into problems, especially for high performers.”
Leaders acknowledged experiencing this challenge as they think through questions of whether to:
- Stay in this environment and enable performance to the best extent possible, or
- Go back to where they were before the pandemic and be mindful of the differential levels of performance
At the end of the discussion for this topic, leaders agreed—what’s important is that leaders strike the balance on what is good for the org.
Leaders & managers should check for bias & intentionality when it comes to feedback
Biases—such as recency (favoring those with whom recent conversations were held or work done) and proximity (favoring those working from the office or closer to the evaluator)—are likely to surface more in a virtual environment since managers can no longer rely on perceptions of who’s working the hardest based on physical presence.
This will increasingly become a bigger issue as some employees return to the office while others don’t. This is why assessments and feedback conversations should be reviewed carefully for such biases.
A few leaders shared specific examples of how they approach it:
- Leverage tech that nudges leaders to give real-time and nonbiased feedback to employees
- Plan to calibrate goals at the beginning of the year—and ensure people get the support and feedback they need throughout the year
- Conduct a combination of training and performance audits to mitigate bias in performance processes—which include incorporating multisource feedback into the assessment process—so it’s not reliant on one evaluator’s appraisal
Intentionality of feedback was also highlighted as a crucial factor that needs to be assessed for a hybrid workforce. As one leader pointed out:
“People assume they know how to give feedback, but in a hybrid environment we don’t have as many opportunities to give feedback. There are fewer nonverbal signals, which is why we need to be more intentional about it and set up time to see where feedback landed.”
It’s extremely important for managers and leaders to be clear about their intent while giving feedback—and check how their feedback is landing in a virtual environment. At the same time, orgs should be mindful of how feedback is being received by employees.
Senior leaders & managers need to upskill to enable performance in a hybrid environment
The ability and need for senior leaders and managers to give feedback, conduct assessments, and work with employees to develop their goals was a theme repeatedly heard during the discussions. Several leaders mentioned that their orgs are actively working to provide managers with programs to help and empower them to have performance conversations and navigate the complexities of hybrid work.
As one of the leaders put it:
“Leaders have learnt it’s more work to manage a team that is completely remote. We have been working on helping leaders understand that and coach them in what they need—which is empathy and the understanding that knowledge workers have to balance work and personal life.”
Leaders shared some of the specific ways to help improve these capabilities, including:
- Providing structure to performance conversations and standard phrases to use
- Addressing how to open a performance conversation virtually versus face to face
- Providing access to collaboration tools to facilitate interaction
- Coaching and feedback to help managers lead a virtual team
- Training to help managers understand the different needs of employees working from home versus from the office
An example of how orgs are approaching this was mentioned by one leader as they shared how their Inclusion team set up virtual 1:1 training with leaders to help them have difficult performance conversations with avatars. The purpose is to train and prepare leaders for end-of-year performance sessions and guide them through challenging scenarios.
PM tech matters, but only if it enables those involved in performance processes
We heard some insightful remarks during the discussion around how tech can and should be leveraged for PM. Tech should enable managers and leaders to have better conversations and provide timely feedback instead of turning these into tasks for managers to check off their lists. One leader highlighted how tech can allow managers to think their job is done once they’ve entered something into the system:
“If managers don’t understand it is their responsibility to drive performance, conversations, and give feedback, no amount or kind of tech is going to matter.”
Another challenge associated with tech is the amount of friction created due to the increasing number of tools that orgs are using, which require managers and employees to input information in multiple platforms—resulting in a poor experience. As one leader put it:
“When it comes to tech, it’s so easy to add on. Sometimes less can be more.”
When it comes to enabling performance in hybrid work, leaders shared that tech can help by enabling teams to understand what everyone’s working on and how that work is progressing in a virtual environment.
Overall, leaders agreed that tech needs to be an enabler instead of just a record-keeping or documentation tool.
A Special Thanks
We enjoyed a highly engaging discussion full of interesting insights. Thanks again to those who attended and made it such an enriching conversation. If you missed out on the chance to attend the roundtable, you can still participate in the study by reaching out to us at [email protected]. If you’re looking for more resources on this topic, please check out our research.
As always, we welcome your suggestions, thoughts, and feedback at [email protected].