Less DEIB training, more learning equity
Posted on Tuesday, May 24th, 2022 at 5:52 AM
L&D's DEIB commitments are growing
As we head further from the catalytic events of summer 2020, it’s heartening to see that organizations are continuing to ramp up efforts on diversity, equity, inclusion, and belonging (DEIB). For example, the Association for Talent Development (ATD) reported that 39% of organizations have introduced DEIB programs in the past 2 years. And organizations appear committed to continuing this trend: A study by Traliant and WBR Insights reported that 79% of organizations planned to allocate more budget and / or resources to DEIB in 2022 compared to 2021.
Like their broader organizations, L&D functions are doing more to foster DEIB. LinkedIn Learning’s 2 most recent annual workplace learning reports (2022 and 2021) indicate that L&D functions plan to deploy more DEIB programs in 2022 compared to 2021. In addition, more L&D functions said they own or share responsibility for DEIB efforts in their organizations (Figure 1).

Figure 1: L&D commitments to DEIB efforts | Sources: LinkedIn Learning Workplace Learning Reports, 2021 and 2022
These growing commitments make a lot of sense: L&D functions should be more involved in DEIB efforts. With their broad and cross-functional reach and their ability to influence expectations for the ways people work and interact with one another, L&D functions are uniquely positioned to drive the kind of deep and widespread culture change that DEIB requires. As Emma Birchall, Global Head of Diversity and Inclusion at Ericsson, put it:
You can’t overstate the importance of L&D in DEIB. L&D is the part of the organization that translates the business strategy into signals to individuals and teams about how they execute on the strategy.
Moreover, improving DEIB is (or should be) an enterprise effort. In our experience, DEIB efforts that are seen as 1 group’s job face an uphill battle. DEIB culture change isn’t something that can be achieved if only 1 team, no matter how dedicated and capable, is committed to it.
As L&D functions continue to become more deeply embedded in their organizations’ DEIB efforts, partnering with teams across the organization—especially DEIB teams—will be key. We touch on this idea of partnership throughout this paper.
3 reasons L&D isn’t more effective on improving DEIB (yet)
Despite the growing sense that L&D functions can and should do more to improve the DEIB cultures in their organizations, many are not contributing as effectively as they could. We see 3 reasons for this:
- Lack of organizational DEIB policy / guidance. Many of the leaders we talked to said they were waiting for an organizational DEIB strategy to be developed before they started incorporating DEIB into employee development experiences.
- Defaulting to training. In many organizations, it’s assumed that training is all L&D functions do (or should do). This can lead to an over-focus on DEIB training as a strategy for effecting change. There’s a good deal of research indicating that one-off, compliance-focused diversity training alone does not improve DEIB in organizations. The article “Why Diversity Programs Fail,” by F. Dobbin and A. Kalev, gives a good overview of why this may be.
- L&D’s own blind spots. In the learning survey that we conducted in December 2021, about 75% of L&D respondents were white (Figure 2). This lack of diversity may make it difficult for L&D functions to recognize their own biases. For example, in our survey, 50% of L&D pros who identified as white said their L&D function proactively applies a DEIB lens to learning opportunities. Only 36% of those who did not identify as white agreed with the same statement.

Figure 2: RedThread learning survey L&D respondents by race / ethnicity (n=288) | Source: RedThread Research, 2021. See appendix for survey methodology and respondent demographics.
Jeffrey M., Senior Manager for Organizational & Leadership Development at a commercial space company, articulated the challenges associated with a lack of diversity within L&D functions in this way:
If you don’t have like me, or someone Latino or Asian on the team, then there’s a certain lack of diversity of thought that’s built into the development opportunities that are offered.
Fortunately, these challenges aren’t insurmountable. There’s a lot that L&D functions can do—starting now—to more effectively drive DEIB cultures in their organizations. That’s the focus of this study.
Focus on learning equity
In our lit review on DEIB & learning, we identified 4 main areas L&D functions consider when approaching DEIB (Figure 3):
- Delivering DEIB training. L&D functions deliver training on topics like unconscious bias, with a focus on making the training more effective and “stickier."
- Making all training more DEIB. L&D functions adapt the language, visuals, physical and virtual spaces, etc., for all trainings to make them more diverse, equitable, and inclusive.
- Developing employees’ DEIB skills. L&D functions identify the skills that will drive a DEIB culture in their organizations and focus on enabling employees to develop those key skills.
- Focusing on learning equity. L&D functions take a systemic approach to DEIB in employee development. They make the systems and processes of employee development more diverse, equitable, and inclusive.

Figure 3: 4 ways L&D can improve DEIB in their organizations | Source: RedThread Research, 2022.
Our research focused on this 4th approach: learning equity. We chose this focus largely because much has been written on the first 3 approaches, but learning equity is a relatively new concept for organizations. This systemic approach was described by Kate Shaw, Director of Learning at Airbnb:
DEIB has to be not just a piece of what you do, but woven throughout everything you do.
In addition, there’s a correlation between a systemic focus on DEIB and high performance. In our learning survey, 61% of L&D pros in high-performing organizations said their L&D function proactively applies a DEIB lens to employee development, versus 36% of L&D pros in the rest of our dataset.
3 elements of learning equity
Our research indicates that organizations are making development opportunities more diverse, equitable, and inclusive by paying attention to 3 specific aspects of employee development (Figure 4):

Figure 4: The 3 elements of learning equity | Source: RedThread Research, 2022.
- Discovery is how employees find out about development opportunities. Employees use a range of formal and informal methods to get information about the opportunities available to them
- Access is which employees can take advantage of a development opportunity if they want to. Employees’ access to many development opportunities is determined by the organization, often based on an employee’s role, skills, job function, job level, or management status.
- Participation refers to which employees actually participate in the development opportunities they have access to.
L&D functions should assess Discovery, Access, and Participation in their organizations to identify where systems and processes may be inequitable or hamper diversity and inclusivity. With a more nuanced understanding of where the gaps are, they can take more targeted actions to close those gaps and improve learning equity.
Discovery
Discovery is a critical component of learning, as it’s what connects employees to the opportunities they need. Some of the ways employees discover opportunities to learn and grow include:
- Informational emails from the organization
- Newsletters
- Assigned or required training
- Searching / browsing on the internet, intranet, LMS, LXP, or other learning platform
- Automated recommendations from learning systems
- Recommendations from senior leaders, managers, peers, or colleagues
Even when several of these methods are available to employees, some groups of people face consistent and systemic barriers to discovering opportunities.
For example, many L&D functions rely on email to share info about development opportunities. But if a large portion of the workforce doesn’t have an email address or can’t easily check their work email regularly, then defaulting to email isn’t an equitable or inclusive method for Discovery. As one roundtable participant put it:
It's inequitable if L&D sends an email about a development opportunity and 30% of your workforce doesn't use email.
We also know—for example, through research we did on DEIB skills—that information about opportunities often flows through informal channels. Some opportunities, like job rotations or special assignments, are open only to those who know about them.
Interestingly, our research found that high-performing organizations make opportunities more transparent (Figure 5). About 81% of employees in high-performing organizations reported their organizations are transparent about the development opportunities that are available, compared to 61% of employees in other organizations.

Figure 5: Respondents who agree their organization is transparent about the development opportunities available to employees, to a significant or very great extent, by business performance (n=1521) | Source: RedThread Research, 2021.
L&D functions can make employee development more equitable and inclusive by making all opportunities explicit and transparent to everyone. With this transparency, employees can find and take advantage of the learning that’s right for them.
Making Discovery more equitable and inclusive
This research uncovered a number of challenges associated with Discovery, as well as some effective ways that L&D functions are addressing those challenges.
Challenge 1: Organizations make access to opportunities too narrow
Historically, organizations make development opportunities available only to employees with an immediate or obvious need. In general, this choice applies not just to costly opportunities, but even to the ones that are free or inexpensive.
This narrow focus limits Discovery: Employees are told only about the opportunities that the organization feels they need, rather than having the choice, freedom, and equity to determine their own career path.
Action: Increase transparency about what’s available
To the extent possible, L&D functions can make Discovery more equitable and inclusive by becoming much more transparent about all the development opportunities that are available.
For example, they might:
- Remove limitations based on role, function, seniority, etc. from what’s visible / searchable in the LMS or LXP
- Review any matching or recommendation algorithms to ensure they’re equitable and inclusive
- Communicate directly with employees rather than relying on managers to disseminate information about opportunities
- If there are different newsletters or email distribution lists for different target audiences, publish those lists and allow employees to opt into them
- Implement a talent marketplace to make projects, gigs, rotations, jobs, mentoring opportunities, etc. more explicit and discoverable by anyone in the organization. This doesn’t necessarily mean implementing a new tech tool: It can be done in a low-tech / low-cost way with spreadsheets, or it can be an add-on to existing learning or HR systems
Making opportunities visible to everyone, even if not everyone gets Access to them, at least enables employees to see more options—to envision different paths they might pursue.
Challenge 2: Different groups of employees use different methods to discover opportunities
Part of what drives inequities in Discovery is the simple fact that not everyone accesses information in the same way.
In our research, we saw some of the largest and most consistent differences in Discovery between frontline and not-frontline workers. Frontline employees often experience challenges using some of the most common methods that L&D functions rely on to share information about opportunities (e.g., email).
Action: Tailor Discovery method by employee group
Leaders said they put a lot of effort into understanding how different groups of employees discover info about development opportunities. Two specific ideas for uncovering these differences are:
- Experiment with different channels. Do some A/B testing. Try putting the same message in different communications channels (e.g., email, chat, intranet, etc.). Track open rates and clicks by employee group and by channel to find out who’s accessing the message where. Reach out to the IT team for information from systems the L&D function can’t pull data from.
- Ask for feedback. Many learning leaders said they value their relationships with Employee Resource Group (ERG) leaders and DEIB team members in part because these individuals can provide insight into how certain employee groups find information about development opportunities.
Mike Murphy, Director of Inclusion and Community Programs at CFA Institute, talked about the importance of having data to identify obstacles to Discovery:
Let’s say I've reached the entire 70-person marketing team but only 12 of the huge IT team. You have to have the data and then ask: What was the obstacle? What's keeping me from getting that message to all the places they are?
With a more nuanced understanding of how different groups of employees acquire information about development opportunities, L&D functions can adjust their efforts to utilize the channels that target audiences rely on the most.
Action: Cast a wide communications net
Another approach is for L&D functions to communicate more, and more widely. Many leaders talked about the need to overcommunicate. They suggested:
- Repeat messaging multiple times in multiple channels
- Leverage influencers in the organization—such as ERG leaders—to get the word out about development opportunities
- Don’t assume tech is best: Think broadly about all the communications channels available. Sometimes paper flyers in a break room are most effective
Leaders emphasized the importance of trying multiple ways of sharing info about development opportunities to increase the chances that all employees will find what they need.
Challenge 3: Some employees have more time and ability to find opportunities
To be sure, employees have a responsibility for their own learning—and part of that responsibility is finding relevant development opportunities.
However, it’s also true that employees’ ability to find opportunities can differ based on the strength of their networks, how much time they can spend looking for opportunities on the clock, their position within the organization, their location, their tech capabilities, and more. Some employees are more privileged in their ability to Discover opportunities than others.
Action: Make Discovery easier for all
L&D functions can make Discovery more equitable and inclusive by making it more automatic and embedded in employees’ work. Some specific ideas include:
- Embed information about opportunities into the places employees do their work—such as chat, browsers, intranet homepages, point of sale systems, time clock systems, etc.
- Incorporate information about opportunities into processes that all employees go through, such as performance and development conversations, onboarding, required / compliance training, or open enrollment for benefits. All these events offer touchpoints where employees could potentially share information about their skills and interests and receive information about opportunities.
- Use tech to match employees with opportunities based on their skills, abilities, experiences, and desires. The recommendation engines in many learning tech systems, especially LXPs, are intended to surface relevant opportunities for employees.
One company makes Discovery easier by asking employees, as part of their regular development planning process, to identify and write down the skills they’d like to work on. This information is fed into the LXP so that it can make recommendations based on those skills.
Real-World Thread: Making Discovery a 2-Way Street
Ericsson, a multinational networking and telecommunications company, has over 100,000 employees around the world. Unsurprisingly, these employees have very different development needs and goals.
To address the challenge of enabling such a varied population to discover development opportunities, Ericsson is taking the burden of Discovery off the employee’s shoulders as much as possible.
To do this, the company is implementing a skills-based learning tech ecosystem that will match employees with opportunities based on their skills signature.
CLO Vidya Krishnan described:
The ecosystem should be intelligent enough that you don’t have to find the opportunities. They find you. It’s a 2-way street.
The skills signature will comprehensively and holistically describe not only what an employee can do now, but what they want to do in the future. This will allow matching algorithms to surface highly relevant opportunities to employees of all kinds.
Access
Access to employee development refers to who can take advantage of a development opportunity if they want to. Access is determined by things like:
- Nominations for select programs
- Logins / permissions to view / consume certain courses in an LMS or LXP
- Manager approval to participate in development opportunities
- Technology (access to computer, tablet, mobile, good internet, etc.)
- Technical capability / tech savvy
- Cost (particularly the ability to pay for opportunities that are then reimbursed)
- Time zone
- Language
In the past few years, some organizations have been working to make Access more inclusive. For example, RedThread's research on coaching found they’re offering coaching in various forms to more employees. They’re also opening courses to more participants (which, in many cases, became possible as in-person courses were put online during the pandemic) or removing restrictions on inexpensive or free content.
Valarie Williams-Foy, Organizational & Staff Development Lead at the University of London, described how the university opens Access to all employees:
We were founded on the value of access, as we were the first university in the UK to allow women. We allow anyone to register for any development opportunity.
In high-performing organizations, more respondents agree that employees have equal Access to development opportunities (compared to employees in other organizations). Figure 6 illustrates this difference: In high-performing organizations, 84% of employees agree employees have equal Access, compared to 58% of employees in other organizations.

Figure 6: Respondents who report people in their organization have equal access to development opportunities, to a significant or very great extent, by business performance (n=1521) | Source: RedThread Research, 2021.
Of the 3 aspects of learning equity, Access is the one with the biggest power differential between employees and organizations. No matter how hard some employees try, they may not be given Access to certain opportunities. This means it’s especially incumbent on organizations to ensure the Access they do provide is as equitable and inclusive as possible.
Making Access more equitable and inclusive
L&D functions are taking targeted actions to address 3 challenges associated with making Access to development opportunities more equitable and inclusive.
Challenge 1: The way skills / abilities are defined, prioritized, and measured may cause Access to be inequitable
In many organizations, there are assumptions and implicit biases that influence how skills and abilities are defined for various tasks and roles. If these assumptions are not reviewed, identified, and addressed, then the criteria used to measure skills and match employees with opportunities may be inherently inequitable.
Action: Make decisions about Access transparent and equitable
As with many DEIB efforts, simply bringing transparency to decisions can help improve equity around who gets Access to development opportunities. To make decisions more transparent, L&D functions can do the following:
- Establish and publicize standardized criteria for any nomination-based opportunities. Criteria can be based on, for example, employees’ current and needed skills, tenure / experience, and career desires. Leaders in this research noted that it’s important to review nominations to ensure they adhere to the criteria.
- Review and revise any underlying or foundational documentation—for example, skills or competency definitions—that might inform decisions about Access to development. This effort can ensure the inputs to decisions about Access are themselves as unbiased and inclusive as possible. It’s likely that some of this documentation lives outside the L&D function, so partnering with other functions is critical here.
- Consider removing human decisions altogether. It’s possible to implement tools or matching processes that can automatically give employees Access to content and opportunities. For example, some internship, apprenticeship, and rotational schemes simply assign people to teams or projects, rather than managers selecting people for their teams.
We particularly like the idea of removing human decisions where possible. In our experience, automatic matches (rather than manager selection) can add more diversity of thought to a team—since nobody is selected for “fit”—and are often more successful than managers or employees might expect.
Challenge 2: Legacy systems, processes, and assumptions can make Access inequitable
Most organizations have legacy systems and processes like HiPo nomination schemes or manager approvals for many opportunities that might limit Access for certain people.
In some cases, for example, managers are reluctant to approve employees’ requests to participate in development opportunities. Often this reluctance is driven by a belief that their teams won’t be able to meet targets if they spend work time learning—or, if the opportunity is a rotation or gig, a fear of losing the employee down the line. In other cases, employees aren’t given Access to courses because the courses aren’t deemed relevant to their work or their career path.
All these legacy systems create potential biases in Access that prevent certain employees from benefitting from some (often highly valuable) development opportunities.
Action: Track Access metrics and step in when something isn’t right
L&D functions can make some of these legacy systems more equitable and inclusive largely by shining a spotlight on who has Access to what, so that inequities become more obvious. To do this, L&D functions can track Access metrics, identify gaps, and step in when something doesn’t look right.
For example, one leader shared that for a HiPo program he ran, he noticed only 9% of nominees were women—when women made up 38% of the target audience for the program. He used this data to get buy-in to rewrite the nomination criteria for the program. The number of women nominees rose shortly thereafter.
Other leaders shared similar stories and emphasized that they couldn’t have intervened or made changes without data. They track access metrics such as:
- Nomination numbers for select programs / opportunities
- Amount spent per employee on development
- Number of employees with access to mentor or sponsorship programs
- Number of employees who have regular career conversations with their managers
These metrics can be sliced and analyzed by categories like frontline status, gender identity, age, seniority, job level, or race / ethnicity (in some countries). Which data cuts are most important will depend on which employee groups are underrepresented in your organization.
Challenge 3: Logistical and operational barriers can make Access inequitable
Logistical and operational factors like timing, language, tech, and cost can all be barriers to Access. For some employees, particularly those on the front line, it can be difficult to Access development opportunities while on the clock. For others, being in the “wrong” time zone or speaking the “wrong” language might prevent them from accessing development opportunities.
When it comes to online and remote learning, tech access is a big issue for some organizations. Some employees may not have the right device(s) or a strong enough internet connection. Some may not be able to afford better internet if they’re working from home, for example.
And affordability is an issue not only for employees but for companies: It can be expensive for organizations to open up access to more employees.
Action: Collaborate to identify and address common barriers to Access
L&D functions should identify and eliminate as many common barriers to Access as possible. In many cases, this means working with leadership, IT, HR, and other teams to make changes.
To address the time challenge, one approach is to try formats or methods that do not require employees to step away from their work for extended periods of time. Some leaders are experimenting with microlearning, for example, so that employees can access development in short snippets. To address some of the other challenges, L&D functions might:
- Provide devices to all employees
- Offer learning stipends and / or prepay for outside opportunities rather than providing reimbursement
- Offer learning methods that allow for flexible schedules
- Allow local teams to tailor or translate language
- Offer events at times that work globally, or multiple access times
- Open opportunities that have little or no marginal cost per employee to all employees, whether or not the opportunities are directly related to their role
These logistical and operational barriers were cited again and again in the course of this research—yet they may not be entirely within the L&D function’s control to fix. In these cases, having strong relationships with other functions can help pay for and provision some of the solutions suggested here.
Real-World Thread: Tracking Access metrics to improve learning equity
South Africa is 1 of a handful of countries with strict reporting requirements on companies’ training spend. Organizations are required to track and report how much they spend to train different groups of employees. These reports prompt companies to show that they have provided equal training opportunities to all employees.
At one major bank in South Africa, the head of learning solutions points out that this reporting isn’t just a check-the-box exercise. It’s the right thing to do, and it’s good for business because it helps increase the quality of all employees at the bank.
The bank tracks Access metrics like how much money is invested in training people from disadvantaged groups. Reports are broken down by job grade, race, gender, and disability status. The reporting requirements have been tightened in recent years to prevent companies from favoring training spend on certain job levels. These tighter requirements complicate the reporting, but ensure a fair distribution of investment across employees at all levels in the organization. Now, reporting targets are set by job grade and job band to drive equity in investment.
Each year, the company spends a percentage of payroll to develop a certain band of employees, with the goal of developing a strong, diverse pipeline of employees moving into job bands and job functions that currently have less representation.
Participation
Participation refers to which and how many employees actually take advantage of the development opportunities available to them. Our past research found that employees participate in employee development by doing 6 things:
- Planning their development and careers
- Discovering opportunities (as discussed above)
- Consuming learning content and experiences
- Experimenting with knowledge and skills
- Connecting with others for learning
- Performing better on the job, and learning while doing it
Participation in development opportunities encompasses all 6 of these behaviors, and there’s a wide variety of methods that employees can use to engage in them. The research we did on learning methods found 66 learning methods, and we’re sure there are more.
High-performing organizations enable more Participation in employee development (Figure 7). For this discussion of learning equity, we broke down our survey respondents’ answers by age, frontline status, gender identity, and race / ethnicity. Across all groups, more employees in high-performing organizations reported their organizations enable them to participate in these 6 employee development behaviors, compared to employees in other organizations. As the saying goes, a rising tide lifts all boats.

Figure 7: Respondents who agree their organization enables them to engage in each learning behavior, to a significant or very great extent, by business performance (n=1530). Similar percentages were found when we looked at these 6 behaviors by employee group. | Source: RedThread Research, 2021.
Still, we know that Participation in most organizations isn’t as equitable or inclusive as it could be: Most organizations have groups of employees who aren’t participating in development as much as they could or should. The challenge for L&D functions is to find those groups of people, figure out why they’re not participating, and fix what’s causing those inequities.
Making Participation more equitable and inclusive
We discovered 3 primary challenges associated with Participation, as well as targeted actions that L&D functions can take to address those challenges.
Challenge 1: L&D functions need better insights on Participation
To make Participation as diverse, equitable, and inclusive as possible, L&D functions must understand where the inequities in Participation in their organizations are and what’s driving those differences.
Data is critical to gaining that understanding with some level of detail and nuance. Without data, actions might be well-intentioned and seem reasonable, but potentially lead in the wrong direction.
Action: Analyze Participation data to identify and address inequities
Data about Participation tends to be more readily available than data about Discovery or Access. Most L&D functions track Participation rates: “butts in seats” is one of L&D’s most well-established metrics. If demographic data is available, L&D functions can use it to slice and dice their Participation data to see where there are differences, and to understand who’s taking advantage of which opportunities.
L&D functions can analyze available data to answer questions about Participation such as:
- How do Participation rates vary by gender, ethnicity, age, frontline status, or other demographics that matter to our organization?
- What differences in Participation show up if we look at various intersectional identities?
- Are different groups of employees participating in different types of opportunities—for example, required training vs. stretch or rotational assignments? Who and why?
- Are some groups of employees spending more time on development opportunities than others? Who and why?
- Do some groups of employees participate in a greater range of development opportunities than others? Who and why?
- Do some groups of employees have stronger connections to more senior or more influential people in the organization who can help them grow? Who and why?
Tania Tiippana, an OD consultant working with a multinational manufacturing company, emphasized the importance of gathering data from all employee groups:
I asked, “Do we have data about how things are working in South Korea? In Poland?” We didn’t. So we did a global needs analysis and tracked participation by gender, location, and so on to find the gaps.
Although the answers to the above questions won’t make Participation more diverse, equitable, and inclusive by themselves, they can help L&D functions prioritize and decide where to take action.
Challenge 2: Messaging about opportunities may exclude certain employee groups
The language and visuals used to market development opportunities matter a lot—they’re often what makes the first impression about an opportunity to an employee. If employees perceive that an opportunity is not inclusive of “people like me,” they may choose not to participate.
Many L&D functions are discovering the various ways their organization’s messaging about opportunities isn’t inclusive, from gendered language to images that only show people of particular ages or ethnicities.
Action: Ensure messaging is DEIB
L&D functions appreciate that messaging should be inclusive and applicable to a broad base of employees. We heard of many efforts in L&D functions to broaden the language they used to describe opportunities, particularly ensuring that the language and visuals represented their organization’s employee population. Specifically, L&D functions were:
- Including broad representation of different genders, ages, races / ethnicities, and worker types (manufacturing, office, retail, etc.) in visuals and language, aligned with the demographics of their workforce
- Ensuring language does not exclude certain groups of employees—for example, using highly competitive language or analogies that only certain people understand (such as sports metaphors)
- Implementing processes to regularly review all messaging through a DEIB lens
A number of leaders recommended partnering with the DEIB team to assess how inclusive the messaging for development opportunities is. Many DEIB teams offer fairness audits. They can review messaging and outreach strategies, and make recommendations for improvements.
Challenge 3: Some opportunities aren’t designed inclusively
Sometimes an opportunity might be inequitable or exclusive because it’s not well-designed for certain groups of people. Participant demographics can also be a source of exclusion. If there are no members of underrepresented groups participating in the opportunity—or in the roles an employee might attain through a particular development path—employees considering the opportunity might be less likely to start down that path.
Action: Incorporate diverse perspectives when developing opportunities
One of our favorite insights from this research is that no matter how much we think through something, it's likely to be biased if only a few people are doing the thinking.
Leaders advised doing one simple thing to reduce this bias: Bring more people into the process. There are 2 main ways to do this:
- Add perspectives to the L&D function itself. There are lots of ways to bring in new perspectives: permanent hires, special projects, rotations, gigs, internships, apprenticeships, and more. One leader advocated for recruiting people from underrepresented groups to L&D early in their careers, so that there’s a pipeline of more diverse L&D thinkers and leaders into the future.
- Ask for feedback. Many, many leaders talked about how they solicit feedback from lots of people in their organizations. They ask for input from ERG leaders, the DEIB team, and focus groups / interviews of employees who are representative of the organization’s employee population.
Based on these diverse perspectives, L&D functions can make changes to things like the format of an opportunity, who participates, or even what opportunities are offered.
Action: Get intentional about demographics
Demographics matter for Participation. But they matter in different ways for different opportunities. Sometimes it makes sense to intentionally build diversity into the participant pool of an opportunity, so that no matter who looks at the opportunity they see someone participating who looks like them. Other times there’s a need to craft development opportunities solely for members of specific underrepresented groups.
The common thread is intentionality. Leaving demographics to chance is where bias and inequity can creep in. This intentionality can also help ensure there is a pipeline of employees from underrepresented groups ready to move into more senior / more visible positions, so that employees coming after can picture themselves on similar paths.
Real-World Thread: Building diverse cohorts
A multinational aerospace corporation has an L&D function that is strongly committed to ensuring diversity within the cohorts that participate in their leadership development programs. There are 3 levels of programs for aspiring, new, and current leaders.
The L&D function believes that if everyone in a cohort looks and thinks the same way, they’re going to get less value from the program. So they scrutinize the demographics of each cohort and ensure each one has diverse representation.
Kevin B., a former DEIB leader at this company and participant in the new leader program, believes that the value he got from the program derived largely from his interactions with other participants. He reflected:
If you have a homogeneous, cookie cutter class, you’re not going to learn a lot. In my cohort, I made tremendous friends with a couple of guys from the UK. I even had someone from the Saudi royal family in my class, which was amazing.
Kevin noted that in some cases it can be helpful to do the opposite—to bring together members from 1 underrepresented group. But in general and for most topics, he believes diverse cohorts learn better from one another.
Wrapping Up
We’ve come away from this research convinced that improving learning equity is one of the best ways L&D functions can contribute to the DEIB efforts in their organizations. Figure 8 summarizes the challenges associated with the 3 elements of learning equity (Discovery, Access, and Participation) and some actions L&D functions can take to address each challenge.

Figure 8: Summary of challenges and actions for the 3 elements of learning equity | Source: RedThread Research, 2022.
Looking forward, we expect L&D functions will continue to make strides to improve DEIB in their organizations—and we think those strides should be focused on learning equity. We hope the ideas in this paper have given L&D functions some concrete ideas about the steps they can take to move their organizations toward employee development that is more diverse, equitable, and inclusive for all.
Note: for Appendices, including study demographics, research methodology, and contributors please download the PDF report.
Roundtable Readout – Learning Methods: Which Ones Work?
Posted on Tuesday, May 10th, 2022 at 12:13 PM
At our recent roundtable called Learning Methods: Which Ones Work, we brought together Learning and Development (L&D) leaders from various industries to talk about learning methods. Specifically, we wanted to understand the learning methods L&D functions are implementing and how they might have changed since the pandemic.
Before we began, we reminded everyone of the research RedThread did last year. We identified 66 learning methods employees are using and how those methods fit into the 6 behaviors in our employee development framework (see our final report Learning Methods: What to use, how to choose, and when to cut them loose). This framework illustrates how different learning methods enable different behaviors.
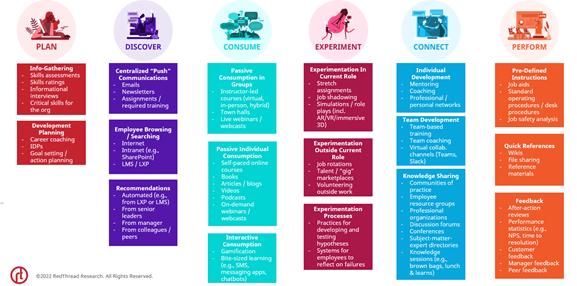
Source: RedThread Research, 2022
We focused on 4 of the 6 behaviors:
- Plan: includes methods that enable employees to plan their development
- Experiment: includes methods that enable employees to experiment with new knowledge and skills
- Connect: includes methods that enable employees to learn from each other
- Perform: includes methods that enable employees to learn while on the job
We chose these methods to push the conversation to those behaviors that L&D may find challenging or areas they are just starting to consider.
Key Takeaways
This roundtable generated several insights we thought were important. This readout shares our top 4 key takeaways.
Skills are an essential driver for helping employees plan their development
Learning leaders are actively thinking about skills—and with that, how to encourage and enable employees to build skills the organization needs. To do this, they're focusing on learning methods such as:
- Skills assessments. L&D is leveraging assessments to better understand the skills employees have and help them figure out how to fill them. As one L&D leader said,
“We’ve started to use skills assessments to fill skills gaps as we begin to think about what the future skills are."
- Individual development plans (IDPs). As organizations focus on individuals and personalization, IDPs appear to be getting new life. One leader said his organization had rebranded the IDP as a Growth Portfolio – a way to plan and record individuals' learning and development that can also show desired career path and competence.
- Career Coaching. L&D sees career coaching as a learning method to help employees build the skills they need. However, it can be a heavy lift for organizations to manage. For this reason, many roundtable participants confirm that their organizations do not rely heavily on career coaching when planning development (our data says 19% of employees).
Experiment methods are slowly gaining traction.
Roundtable participants noted that learning methods geared toward helping employees experiment with new knowledge and skills (job rotations, job shadowing, informational interviews, etc.) were becoming more common within their organizations.
“We’re trying to do more job rotations. We’re thinking about the skills of the future and how we bridge those gaps. Especially for new employees and HIPOs – how do we get them into those rotations?”
As L&D works to utilize these methods, many are facing 2 challenges:
- Systemic issues. L&D leaders find ”experiment“ methods challenging to manage and track. But they’re still making it work. One leader said her organization is trying to leverage its talent marketplace to enable employees to experiment with new knowledge and skills (e.g., scheduling informational interviews).
- Structural issues. Many participants also noted that the L&D function isn't the sole owner of many experiment methods. Because it is a shared responsibility in many cases, it’s sometimes unclear who's in charge and who is driving the initiatives, or it takes too much coordination. Others mentioned that their organizations don't yet have the structure to encourage experiments on a larger scale.
The pandemic left many employees feeling bereft of support and connection.
Before the pandemic, there was a big focus on self-service learning. After the pandemic, one of the themes appears to be connection in learning. Roundtable participants mentioned that they see connection in the following ways:
- Both internal and external connections. Organizations are looking for ways to help employees connect internally with other employees for learning but are also looking to connect them with experts on the outside. A participant noted that the top 2 most relied upon Connect methods, from RedThread Research’s learning survey data, focus on building networks outside of the organization (prof networks = 39% and social networks = 28%).
- Employees feel responsible for helping their peers learn. L&D leaders are observing that employees have a desire to learn from each other. For one L&D leader, a recent survey in their org found that 68% of employees felt accountable for contributing to the learning of others. They continued by saying,
"This was 20 percentage points above benchmark. This data influenced our strategy—how can we facilitate that natural strength of our learning culture?"
L&D leaders are trying to figure out how to support the shifts in connection. As one participant said,
“Do we want to support colleagues in creating external and internal connections or leverage collective knowledge in the organization by supporting connections among colleagues?”
Choices in how methods are implemented can affect how equitable learning opportunities are
The idea of learning equity or development equity resonated with roundtable participants. We weren't surprised to hear this, as more L&D functions are taking on responsibilities having to do with Diversity, Equity, Inclusion, and Belonging.
Participants drew a connection between more personalized planning and offering more learning methods and a more equitable experience. One leader said,
“Everyone has an opportunity to grow. We’re making it easier for individuals to capture the strengths / skills they have and what they want to develop more of. So, let’s allow people to tell us what they’re good at and tailor the learning to that.”
Additionally, participants mentioned the need to tweak systems and processes related to access to learning methods. For example, online courses are often reserved for those with specific titles or in certain areas of the company. Instead, L&D functions should work to provide as much access as possible to as many as possible, cost permitting.
Thank you to all who participated and shared their experiences. We welcome your suggestions, thoughts, and feedback at [email protected].
Roundtable Readout: L&D's DEIB Opportunity
Posted on Tuesday, April 26th, 2022 at 5:49 AM
In April 2022, we convened a roundtable for leaders to discuss how L&D functions can make employee development more diverse, equitable, and inclusive. This session was part of our research into what we're calling L&D's DEIB Opportunity. We aim to identify the most effective things that L&D functions can do to support diversity, equity, inclusion, and belonging (DEIB) efforts in their organizations.
This readout shares some of the highlights from the session. Thank you to all who participated, shared their experiences, and learned from one another.
L&D's DEIB commitments are growing
To frame the conversation, we shared data from LinkedIn Learning’s 2021 and 2022 Workplace Learning Reports (Figure 1). L&D functions are not only planning more DEIB programs, but they’re taking on more ownership of DEIB efforts.
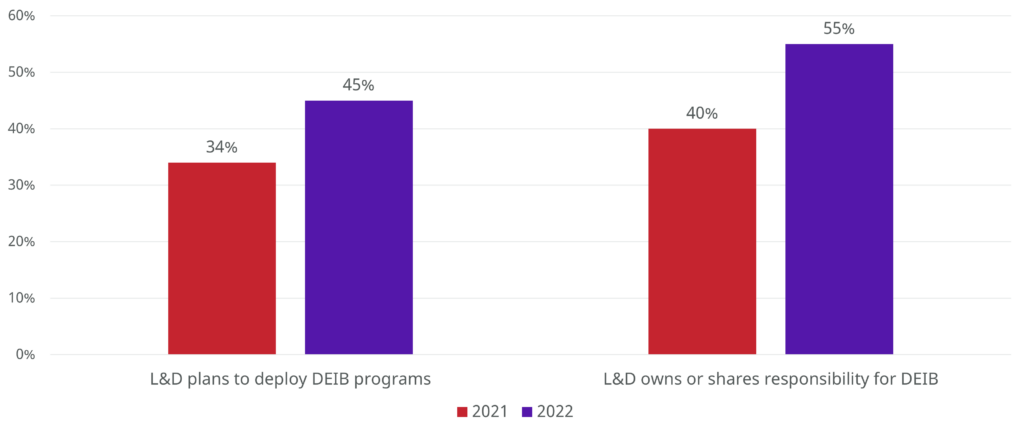
L&D's DEIB commitments are growing | Source: LinkedIn Learning Workplace Learning Report, 2021 and 2022.
When we asked roundtable participants if they were seeing or experiencing this trend themselves, they agreed. They wrote in the chat things like:
- “Definitely”
- “Absolutely”
- “Without a doubt”
How can L&D functions meet these growing responsibilities?
To answer this question, we focused on how L&D functions can make the systems of employee development in their organizations more diverse, equitable, and inclusive. We discussed 4 aspects of employee development:
- Discovery. How do employees find out about development opportunities? How can L&D functions enable different groups to more equitably discover those opportunities?
- Access. Which employees could take advantage of development opportunities if they chose? Who has permission / is nominated to attend? Who has the right tech? How can L&D functions enable different groups to more equitably access development opportunities?
- Participation. Which employees participate in development opportunities? How does participation differ across groups, and why? How can L&D functions enable more equitable participation across groups?
- L&D itself. How might L&D’s systems and processes be biased or inequitable? How might L&D functions address those inequities?
Key takeaways
The roundtable generated a number of insights we thought worth highlighting. Here are our top 5 takeaways.
To make learning more DEIB, focus on how decisions are made
Perhaps unsurprisingly, the ways decisions are made have a huge effect on whether employee development is equitable, inclusive, and accessible across the various groups in an organization. Decisions about who can access certain development opportunities are particularly impactful. One participant shared the following anecdote:
I used to work for a large corporation. Pre-pandemic, we would fly people in for exclusive leadership development programs. The lack of diversity was astounding. The programs are great, but they're often reserved for people who are already privileged. I had to ask myself: Who's approving these attendees? Who's got the budget?
Leaders shared 2 ideas for reducing such biases.
- Make decisions transparent. One organization implemented decision-making frameworks to help managers and leaders understand the different factors that weighed into their decisions. These frameworks also help leaders explicitly focus on the criteria that align with their values and the organization's values.
- Make matches, not decisions. Another organization is using skills to remove some decisions entirely. By ensuring every employee has a skills profile (or skills signature), the organization can match employees with specific skills needs and gaps with appropriate development opportunities. The system makes the match, not a leader.
We thought these 2 ideas for reducing bias in decision-making were practical approaches that might apply in many organizations.
Marketing and messaging can include or exclude
A second insight from the group is just how important marketing and messaging are. They influence who learns about what development opportunities and—arguably more important—who decides to take advantage of those opportunities.
A portion of the conversation focused on whether outreach and marketing activities reach the people L&D functions intend them to. As one leader put it:
It's inequitable if L&D sends an email about a development opportunity and 30% of your workforce doesn't use email.
Leaders suggested marketing development opportunities in multiple channels—overcommunicating—and ensuring opportunities are marketed where employees are. For example, a paper flyer in a break room or stand-up meeting might be most effective for reaching front-line employees who do not regularly check email.
In addition, leaders noted that the language, visuals, and tone used in marketing communications about development opportunities can affect whether an employee thinks an opportunity will be relevant and helpful to them. They should be able to see themselves in the opportunity, or they may not choose to participate even if they have access.
Analytics and data can reveal systemic inequities
Leaders in this roundtable emphasized the need to check assumptions about whether development opportunities are as DEIB as L&D functions might hope. Ideally, they said, the demographics of the people who participate in development opportunities should roughly mirror the demographics of the organization's employee population.
Leaders shared that some reasons for differences in participation rates between groups might be:
- Lack of technical access to training (e.g., cannot access learning on mobile phone, do not have a company-provided device, do not have good enough internet access). The ability to pay for tech to access development opportunities is also a potential source of inequity.
- Messaging / marketing doesn’t speak to certain groups
- Certain employees aren't afforded the time to access learning within their work day and cannot / do not want to participate on their own time
Tracking participation in development opportunities over time to see if attendees do, in fact, mirror the population can help reveal possible gaps in marketing / messaging, access, etc. The importance of tracking data over time was articulated by one leader who noted:
We can make plans that we think allow for universal access, but until we check to see whether in fact the result is representative participation, we don’t know whether our approaches are in fact creating equal access.
One leader shared that in her organization, they do A/B testing like marketers. They look to see who's registering for opportunities, who shows up, who consumes content online, etc. They analyze this data by all demographic / diversity statistics that are available.
L&D functions should rely on DEIB resources across the organization
Leaders in this roundtable agreed that as L&D functions take on more of a role in DEIB efforts, they cannot and should not do it alone. There are many resources across an organization that can help L&D functions identify and address inequities in employee development.
For example, the leader whose organization does A/B testing recommended reaching out to the IT team. They can help L&D functions access data about who's clicking where, which employees have company-supported devices, and—in many organizations—aggregated data on how many employees have downloaded accessibility software (screen readers, etc.).
Other leaders noted all that DEIB teams can offer. A number of leaders said the DEIB teams in their organizations do "fairness audits" for business functions to help identify gaps. They can do this for the L&D team, for example by auditing the fairness of L&D's messaging, communications, and learning platforms.
A third resource leaders noted were Employee Resource Groups (ERGs). They recommended involving ERGs in marketing / messaging for development opportunities, assessment of how different opportunities appeal to / impact different groups, and the creation of new opportunities.
Virtual work made some learning more equitable
Leaders noted that when the pandemic forced them to put many in-person, cohort-based development opportunities online, they saw a marked increase in participation rates in these programs. And not only did participation increase, but it often increased in terms of diversity: more diverse employees attended. Leaders attributed this change to a few factors:
- Virtual is easier to attend. Trainings were shorter and didn't require travel or overnights away from home. This meant it was easier for caregivers (who are disproportionately women and members of underrepresented groups) to attend.
- Diversity begets diversity. Leaders reported that in their organizations, as more people saw people like themselves participating in or leading learning, they felt more comfortable participating themselves. As such, they saw an increase in participation from people who'd never attended trainings.
One leader offered a counterpoint to this general trend. After the pandemic started and her organization shifted to remote work, she saw a marked decrease in participation rates. When she asked employees why, they told her that before the pandemic, they only requested to attend training because it got them out of the office. Their experience in-office was toxic; they felt they couldn't express themselves. Working from home, they didn't feel the same need to escape.
We were grateful for the open and vulnerable discussion during this roundtable. We welcome your suggestions, thoughts, and feedback at [email protected].
Future-proofing L&D: Developing the Right Skills
Posted on Tuesday, April 19th, 2022 at 3:21 PM
In December of 2021, ByteDance, which owns the better-known TikTok, dissolved its learning & development function. According to CNBC, the entire department was let go over the holiday break in a virtual meeting.
Their reason for this drastic move? ByteDance felt that “many learning events, such as online talks of mediocre quality…that could easily be found on the internet didn’t make good use of their employees’ time.” In an internal memo, ByteDance also mentioned that initiatives were more feel-good activities with limited and questionable value.
In short, L&D wasn’t cutting it.
L&D’s Oh Sh!t Moment
The ByteDance story—and other stories we've heard—indicate that L&D functions may be having an "Oh, sh!t!" moment. L&D functions are facing bigger, more complicated challenges than they have before. These challenges are causing L&D functions—and senior leadership—to reevaluate what they do, how they do it, and the skills they need to do it well.
Yet this moment comes at a time when L&D functions have never been more visible. The past 2 years have created renewed awareness of the importance of employee development. Indeed, L&D functions are being called upon to solve some big problems.
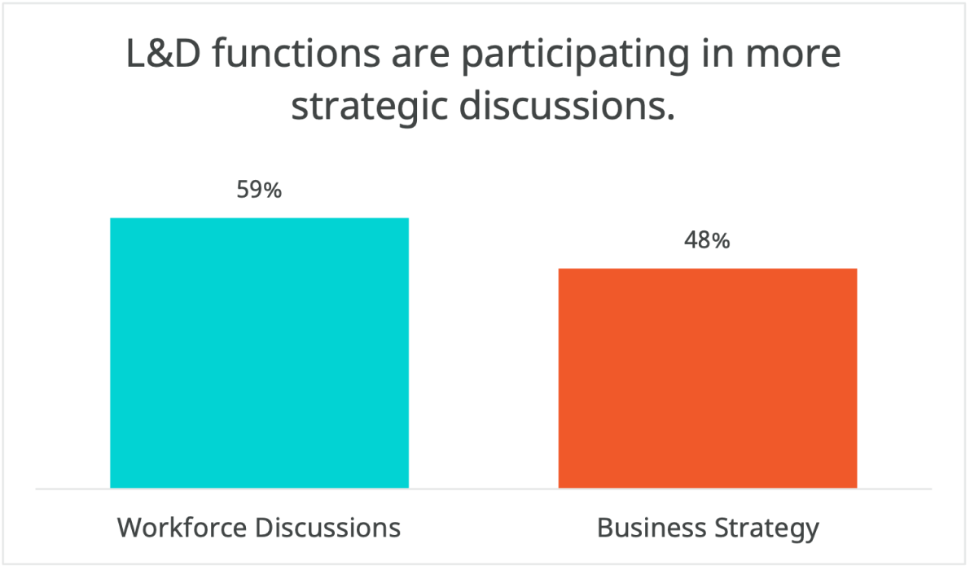
Many senior leaders are looking to L&D functions to guide skills, skills data, upskilling, reskilling, and mobility, in an effort to meet the needs of their ever-changing environments. Our data indicate that L&D is being involved in larger strategic discussions and workforce planning in about 50% of high-performing organizations. A percentage that high would have been unheard of a decade ago.
Additionally, according to Glint's 2021 Employee Well-Being Report, “Opportunities to learn and grow” is the most important driver for a great work culture, a stewardship owned by the L&D function. Employees expect more than page-turner courses or day-long events. And if we connect the dots, opportunities to learn and grow affect culture, productivity, engagement, and retention.
The problems L&D is tackling—upskilling, agile workforces, mobility, work culture—aren’t small. They’re big and important and relevant, which is both a blessing and a curse. L&D has been seeking a “seat at the table” for years. They finally, undeniably, have one. The question now is, do they have the skills they need to do something at that table?
Learning and Development Skills
We want to start by acknowledging that some good work has been done to identify skills L&D pros need. Of note are LPI, ATD, and Training Industry, all of which have capability models outlining L&D skills.
Our intent with this research was not to create another capability model. Instead, we are interested in the skills that L&D pros in high-performing organizations think they will need to focus on developing to meet near-future needs.
All the Skills
To avoid bias (and to make our lives harder), we asked 300 L&D pros the following open-ended question:
What are the top 3 skills you feel L&D functions will need for the future?
We coded their answers, combining those that were similar, and grouped them into larger skills groups.
In all, L&D pros identified 39 skills. These skills were then categorized into 7 skill groups. The graphic below shows the relational focus of these skills and groups. The larger the bubble, the more L&D pros mentioned the skill. The percentages represent the percentage of the total number of skills mentioned that fall into each category.
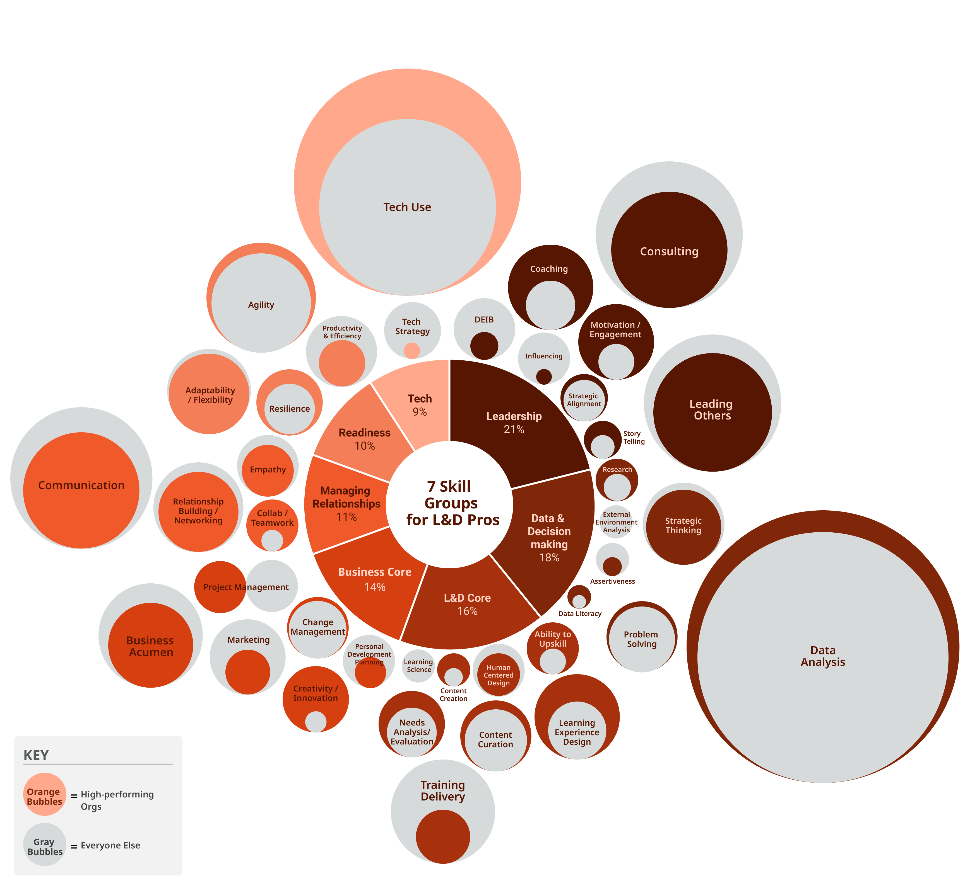
Figure 2: L&D Skills for the Future n=641. Colored bubbles = high-performing orgs; Gray bubbles = Everyone else. | RedThread Research, 2022
Click graphic to enlarge, or see our infographic for this study.
The skills identified by L&D pros were varied and nuanced. They give some insight into the kinds of challenges L&D pros and functions may be facing.
In fact, in looking at the names of the larger skills groups, we see many indications that L&D’s influence is expanding, as its responsibility:
- Leadership: skills to lead inside and outside the L&D function
- Data & Decision-making: skills to use data for making better decisions
- L&D Core: skills to build the capabilities of the workforce
- Business Core: skills to understand and align with business strategy
- Managing Relationships: skills to build and maintain relationships, internal and external to the L&D function
- Readiness: skills to help individuals and functions readily adapt to changing environments
- Tech: skills to leverage tech to upskill the workforce
This data—the skills identified by L&D pros—tells us that L&D pros need to be more than just instructional designers. They need to know much more than just adult learning theory. In this day and age, and particularly at this very strange moment in history, they need to be entrenched in the organization.
At the same time, we know that focusing on building all the skills will lead to focusing on none of them. Understanding the 39 skills L&D pros think they need is only the first step.
Understanding the ones they actually need is the next.
Skills in High-performing Organizations
Determining which skills L&D people need is an inexact art. The existing literature bases skills recommendations on expert opinion, asking L&D pros and thought leaders what challenges – and skills – L&D professionals will need next.
We took a slightly different tack. Instead of asking experts, we looked at the data L&D pros provided about the skills they thought they needed for the future. We then asked them how their organizations were performing, using these 4 measures:
- Met or exceeded its business goals for the last three years
- Responds quickly to marketplace changes
- Innovates faster than its competitors do
- Customers are more satisfied than its competitors’ customers
We then combined these 4 measures into one score and assigned that score to each L&D pro that gave us data on skills. Finally, we identified those L&D pros with scores in the top 25% to determine which were associated with high-performing organizations.
Finally, we compared the skills that L&D pros in high-performing organizations were focusing on with the ones L&D pros in other organizations named. The results, shown in Figure 3, revealed some interesting differences.
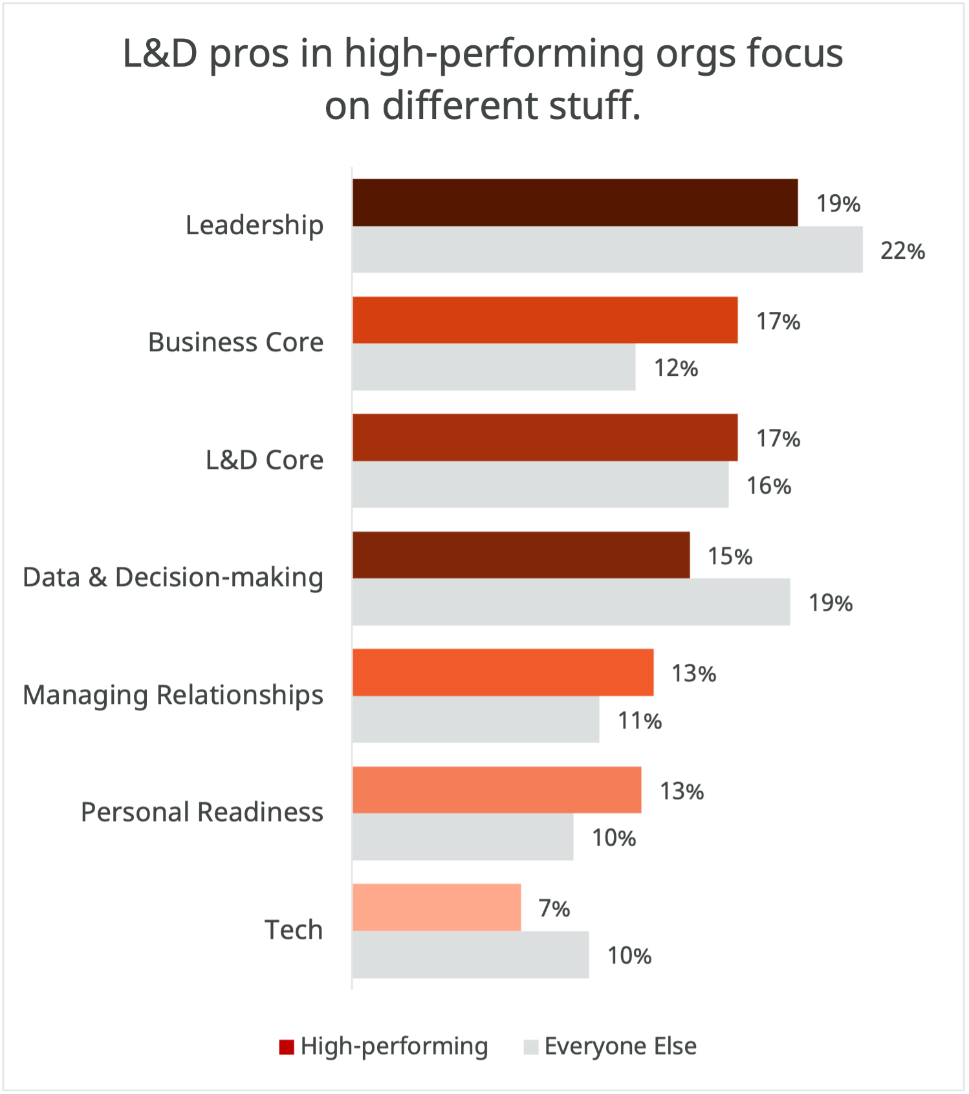
Figure 3: Focus on Skills, L&D Pros in High-performing Organizations vs. L&D pros in other organizations n=641|RedThread Research, 2022
The results got even more interesting when we combined our observations from this data with the insights we gathered from interviews and our roundtable.
Four differences stood out to us. L&D pros in high-performing organizations likely:
Are already focusing on leadership skills
We know that L&D pros in high-performing organizations participate in workforce and strategy discussions significantly more than their counterparts in other organizations.
So while it may look like L&D pros in other organizations are more focused on Leadership skills than those in high-performing organizations, it's likely because they perceive those skills as a need. L&D pros in high-performing organizations have likely already acquired them.
Have already built data into their decision-making process
Anecdotally, higher-performing organizations are more attuned to Data and do more information-gathering, and it is more ingrained in the way they currently operate. Other L&D pros may not have developed these competencies or the systems to support them in their work, resulting in a higher recognition of the need to meet future (or current) needs.
See connecting their work to the business strategy as key
L&D pros in high-performing organizations focus significantly more on Business Core skills. Both the quantitative data and the data collected from our interviews and roundtables indicate that L&D pros in high-performing organizations tend to draw more explicit connections between what they do and the goals and strategy of the organization. They also tend to have a deeper understanding of the business goals, and they tend to make decisions based on those goals.
Focus on relationships more than their counterparts do
Finally, as we'll see throughout this report, L&D pros in high-performing organizations tend to focus more on relationships.
High-performing organizations tend to have L&D pros who understand their place in the larger ecosystem and value their relationships with other functions.
These 4 broad differences can give us high-level insight into where L&D pros may want to focus. However, the devil, as they say, is often in the details.
We also saw differences among the 39 individual skills between L&D pros in high-performing organizations and their counterparts in other organizations.
The Skills Groups
In the following sections, we’ll provide more information about each of the 7 skills groups, including the individual skills within each. Our goal is to explore why each group and their respective skills may be important at this point in history.
We’re also interested in the blind spots—the places where L&D functions may be over- or under-emphasizing certain skills. To determine what those blind spots may be, we compare the skills that L&D pros are focusing on in high-performing organizations with other L&D pros may be focusing on.
Leadership
L&D pros view their own leadership skills as the most important group of skills for the future. Twenty-one percent of all skills mentioned fell within this category.
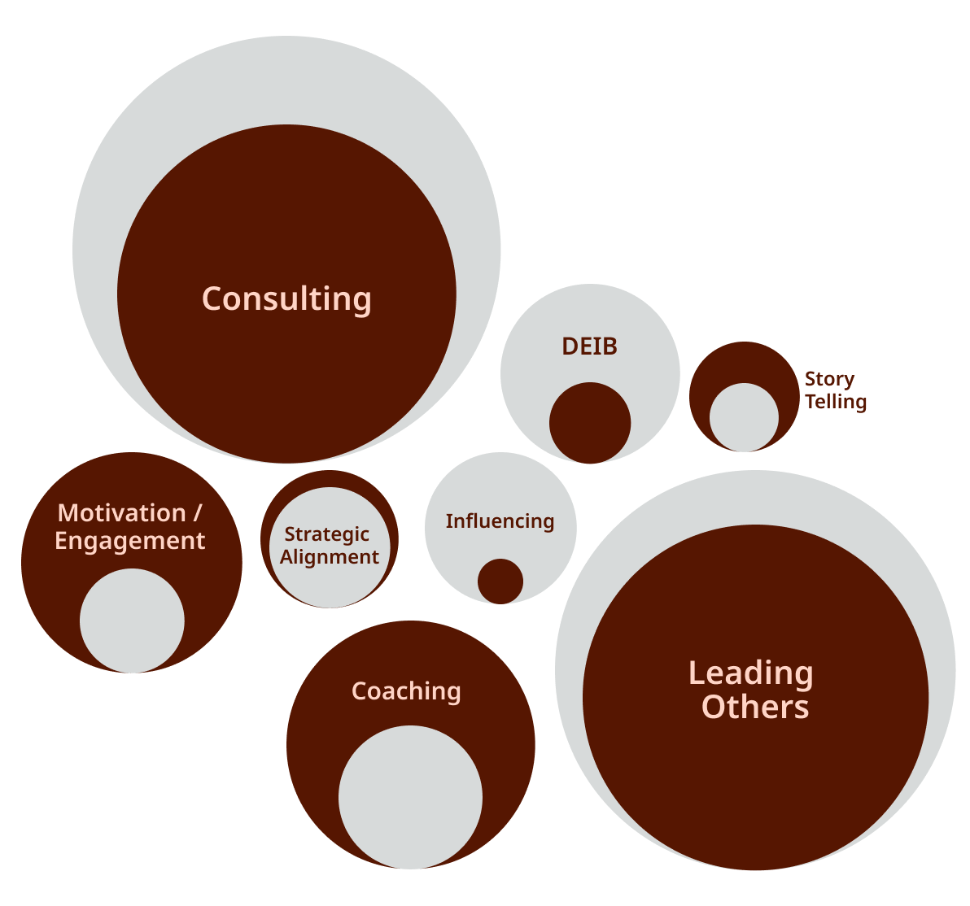
Figure 4: Leadership skills groups, n=136| RedThread Research, 2022
That 21%, validated by our interviews, are indicators of the breadth of leadership responsibilities L&D pros currently have. Kirsten Jackson, a Director of Leadership Development, told us:
We’ve really done a lot of work in the last couple of years to make sure L&D has a seat at every table—tables at the business function level to understand development needs, but also tables at the enterprise level to understand leadership expectations, goals, and how L&D can support them.
But it isn’t just these significant initiatives that L&D pros find themselves leading. In our research, we found that a lot of L&D functions are becoming much more strategic and intentional about employee development. They offer more learning methods and integrate more development opportunities into the workplace than in the past.
These changes from reactive to proactive, from just-in-case to just-in-time, and from learn-in-a-classroom to learn everywhere, require L&D functions to change the hearts and minds of business leaders and employees alike. Leadership skills like consulting, coaching, and motivation and engagement ensure that L&D professionals will be able to make these adjustments.
Leadership: Blind Spots
These findings don’t constitute hard and fast recommendations. Each L&D function should consider all of the variables – internal and external, that may affect the skills they need. That But we did identify some areas that may be getting either too much focus or not enough from the L&D professional population as a whole.
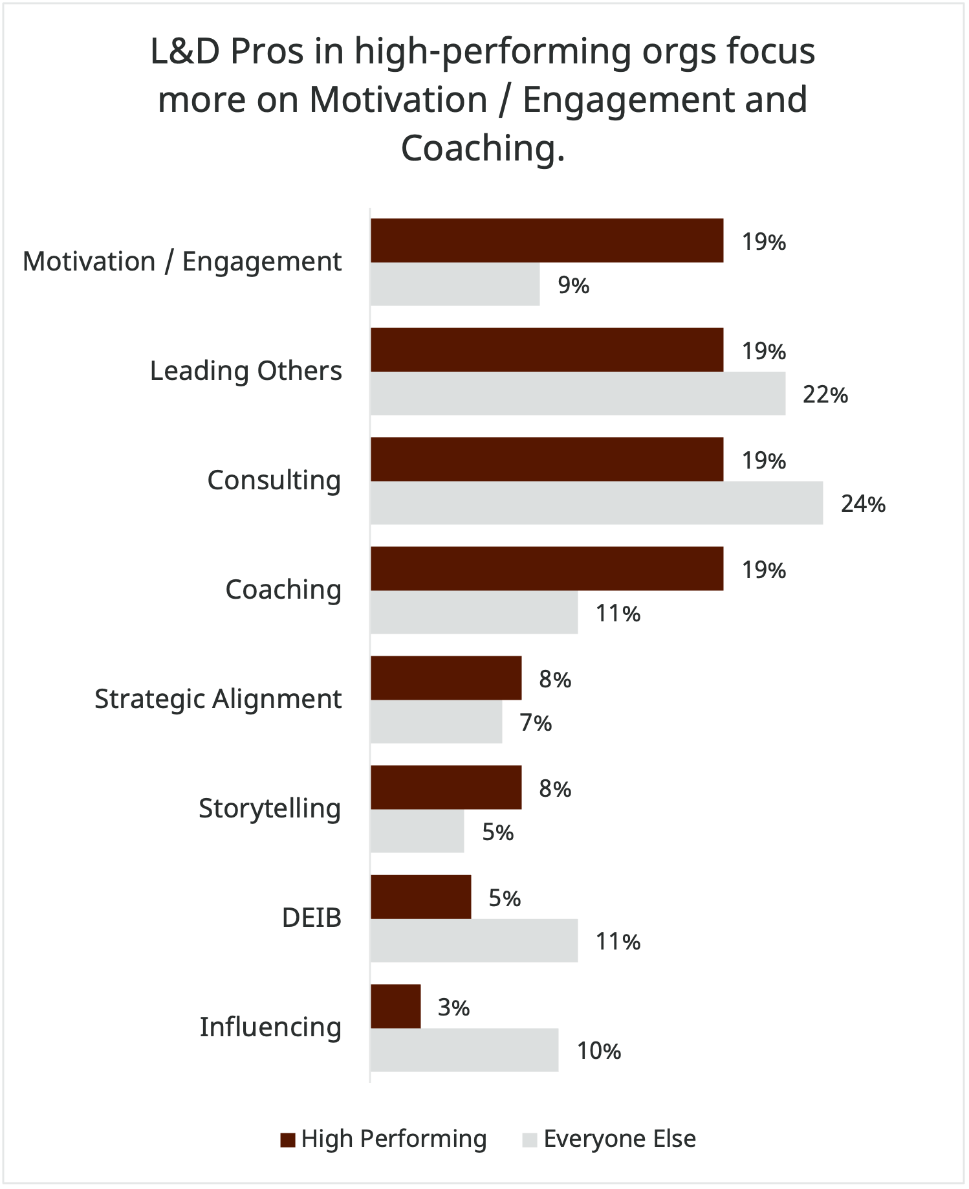
Figure 5: Leadership skills focus, L&D pros in high-performing orgs vs. L&D pros in other orgs, n=136 | RedThread Research, 2022
Focus more on Coaching, Motivation & Engagement, and DEIB
L&D pros in high-performing organizations focus almost twice as much on Coaching and Motivation & Engagement as their counterparts in other organizations.
We have observed that organizations, particularly those adopting hybrid and remote practices, are continuing to look for ways to connect and engage with employees. A stronger focus on Coaching and Motivation & Engagement can help organizations build those connections into their development practices.
Gina Montefusco, Associate Director of L&D, at United Healthcare Group, sees Coaching as a crucial skill for internal L&D leadership as well as external consulting:
Coaching is super important. You can use it to understand your business better and be more comfortable asking questions. I do think that my coaching experience has made me a better consultant overall, because now I ask questions differently.
In our 2022 yearly trends report, we mention that the human is becoming more critical. The fact that L&D pros in high-performing organizations are focusing on skills that further that mission is not lost on us.
We would also be remiss if we didn’t mention the abysmal showing for DEIB skills. While we are happy that this skill showed up at all, the percentage of L&D pros that mentioned it is pretty low. And it's even lower among L&D pros in high-performing organizations.
LinkedIn Learning’s 2022 Workplace Learning Report says that 55% of L&D functions own or share responsibility for DEIB initiatives. L&D pros should be building these skills and looking for opportunities to align their work with DEIB initiatives.
Focus on a broader set of Leadership skills
L&D pros in high-performing organizations tend to focus more evenly across key leadership skills while L&D pros in other organizations tend to focus quite heavily on just some of them.
This uneven focus may mean that L&D pros are putting too much focus on some while ignoring others. For example, L&D pros in other organizations focus more on Consulting (6 percentage points more) and Influencing (7 percentage points more) than those in high-performing organizations.
This focus on specific skills may be key to being effective in their particular organizations, but L&D pros should at least consider how they’re spending their development time and money, and what those skills can get them.
Data & Decision-making
Within Data & Decision-making, the top skill mentioned by L&D pros was Data Analysis. In general, we think that a focus on data skills is good, and it has been missing from most L&D functions for years.
We grouped Data Analysis with other skills used to make better decisions, as Data Analysis is a tool rather than an end unto itself. To be useful, Data Analysis must necessarily be tied to questions, which are ultimately tied to decisions. Other skills in this group are highlighted in Figure 6 below.
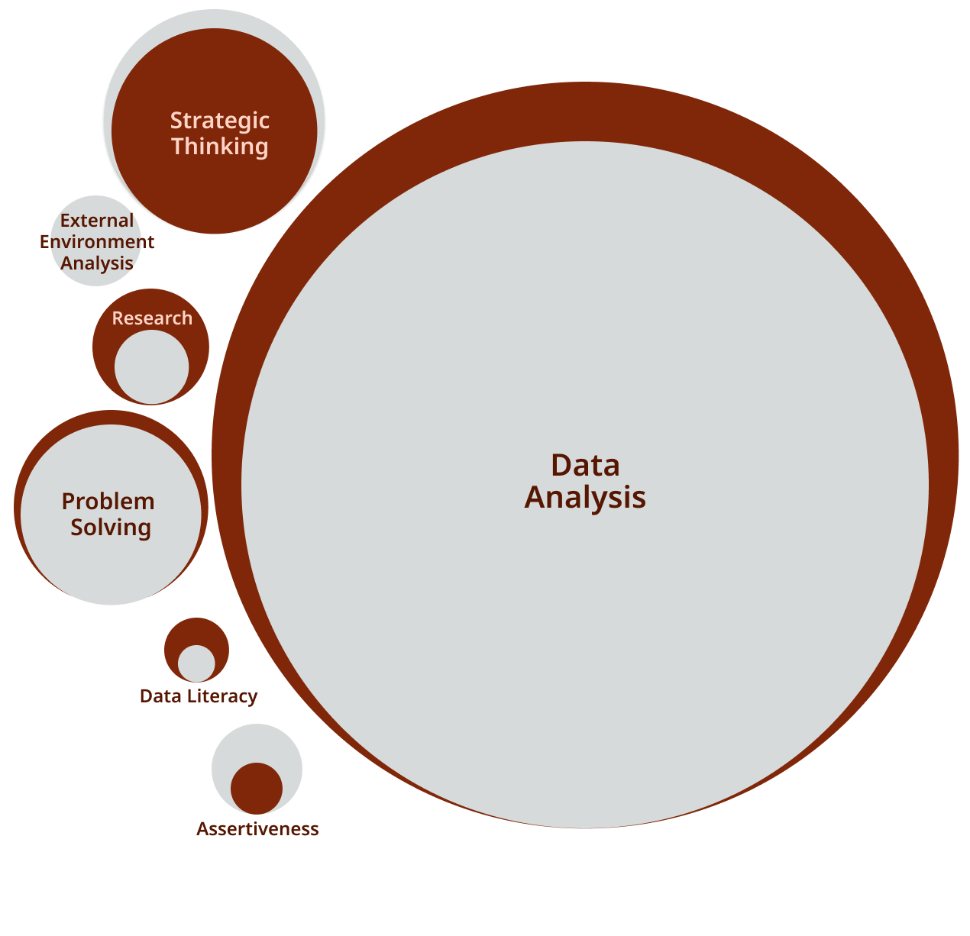
Figure 6: Data & Decision-making skills group – % of focus on each skill, n=113 | RedThread Research, 2022
As L&D pros take active roles in bigger, more strategic conversations, the need for skill in Data Analysis grows. One L&D leader mentioned that data was a language that businesses speak. Data Analysis is crucial for L&D pros as they try to identify the skills organizations and individuals need and then identify experiences that will help them grow those skills.
Many leaders mentioned that they’re looking more deeply at LMS, LXP, and other learning data to understand what their users need. Some have also started to analyze data outside of L&D. Another L&D leader, for example, looks at engagement data:
We look at data from many sources. So, for example, we look at employee engagement scores—questions like, “Do you feel supported by your manager?” This data helps us understand what our leaders will need in the future.
It’s great that L&D is focused on data. Where it gets tricky is how “data” is defined and what other sources L&D pros should be considering, which brings us to a blind spot for Data & Decision-making.
Data & Decision-making: Blind Spots
While L&D pros have started to focus on leveraging data for decision-making, they may be failing to develop other skills that could help them make sounder decisions. And by the way, this is true for all L&D pros. In this case, there was no significant difference for those in high-performing organizations.
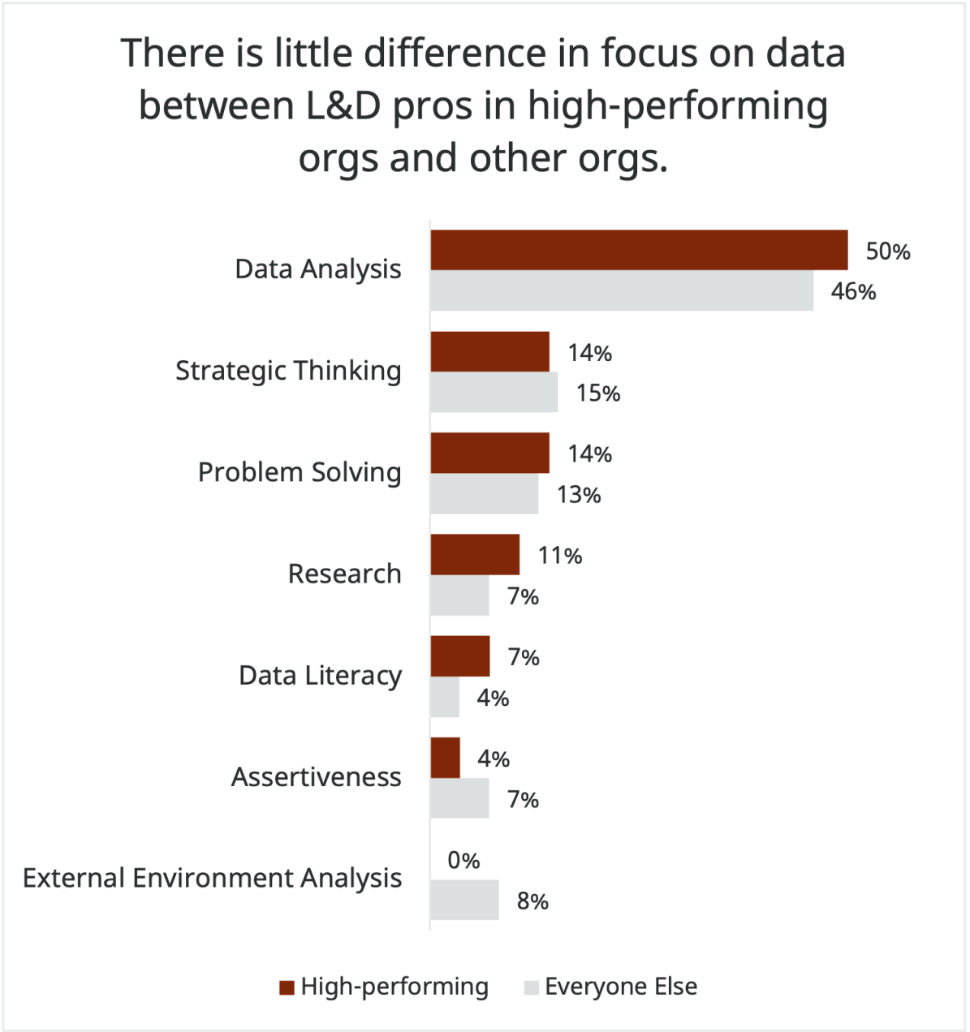
Figure 7: Data & Decision-making skills focus, L&D pros in high-performing orgs vs. L&D pros in other orgs, n=113 | RedThread Research, 2022
Focus more on different data-gathering skills
Data-gathering skills include External Environment Analysis, Data Literacy, and Research. These activities may not always result in hard numbers, but many of the insights they yield can be key to better decisions. Not all data is quantifiable. Trust us. We're researchers.
Focus more on decision-making skills
Problem-solving and Strategic Thinking fall within this subcategory. Frankly, we’re a little surprised we didn’t hear more about them. As L&D pros exercise these skills, they’ll likely see more possibilities and solutions.
So, to sum up: L&D pros recognize the need for better decision-making. And they recognize that Data Analysis skills are a big part of that. But they shouldn’t develop these skills at the expense of other underdeveloped skills.
L&D Core
Not surprisingly, L&D Core is important to L&D pros. Several pros pointed out the importance of these skills to their job and, if they were a leader, their employees’ jobs.
And rightly so: L&D pros bring an essential and unique skill set—one that no other group has—to help organizations solve the development challenges they face.
Learning Experience Design and Training Delivery top the list of skills L&D pros feel they need in the L&D core skills group.
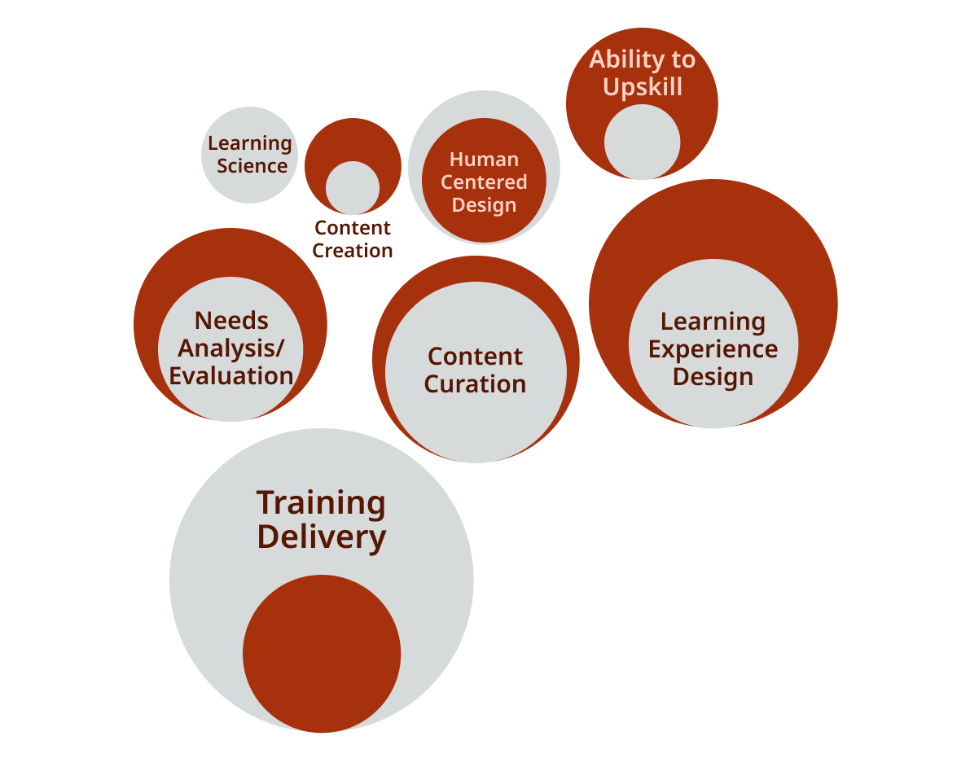
Figure 8: L&D Core skills group – % of focus on each skill, n=105 | RedThread Research, 2022
Training Delivery and Learning Experience Design top the list of essential skills in L&D Core. This is not surprising, given that many L&D pros get degrees and certifications in these skills, and have based their careers on their application.
However, what was surprising was the number of other skills that popped up in this skills group. Human-Centered Design, for example, or the Ability to Upskill, have been recognized only relatively recently as skills that L&D pros need.
Another unsurprising but still growing skill was Content Curation. Its relative prominence hints that L&D pros understand that their responsibilities go much further than creating a course. It may have more to do with assembling the right information and creating the right context and experience.
When we talked to L&D pros about the skills they need specific to L&D, we heard traditional answers, but with a twist. For example, where Training Delivery used to be all about facilitating classroom initiatives, L&D pros mentioned new methods used to “deliver” learning, including coaching, stretch assignments, and external content.
L&D leaders are also looking for broader skill sets when it comes to L&D Core. Ryan Cozens, Learning & Development Lead, Well Health, said:
I think instructional design is an important skill, but it can’t be the only skill. There have to be mindsets and behaviors tied to that. I’m not just looking for someone with the ability to design really incredible self-directed asynchronous learning; I’m looking for someone who understands and can see the bigger picture.
Indeed, L&D Core skills are changing. L&D pros are looking at traditional skills differently, and they're introducing new ones for the future.
L&D Core: Blind Spots
L&D Core skills were the 3rd most important group of skills identified by the L&D pros we surveyed. But, as we saw above, when we look at the focus of L&D pros in high-performing organizations versus those in other organizations, we see they rated L&D Core skills at the same level as Business Core.
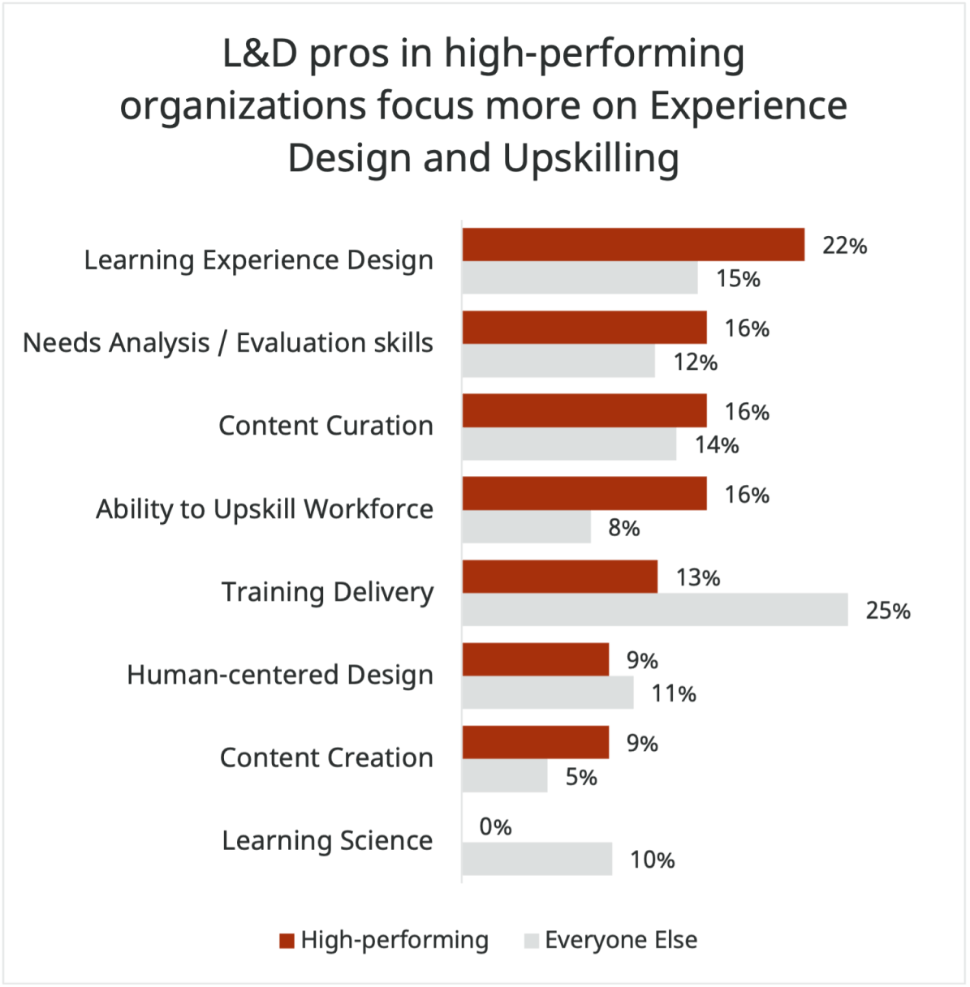
Figure 9: L&D Core skills focus, L&D pros in high-performing orgs vs. L&D pros in other orgs, n=105| RedThread Research, 2022
That Business Core and L&D Core are considered equally important is telling. It indicates that L&D in high-performing organizations are likely more aligned to and focused on business challenges than more traditional L&D functions.
There are also some key differences between the particular focuses of L&D pros from high-performing organizations focus and those in other organizations. Two caught our eye.
Focus more on Experience Design and Upskilling the Workforce
First, L&D pros in high-performing organizations focus more on Learning Experience Design (7 percentage points more) and Upskilling the Workforce (8 percentage points more) than their counterparts in other organizations.
These differences might indicate that L&D pros in high-performing organizations are more attuned to the entire experience of learning and ensuring that the workforce has the right skills. This, in concert with the other skills they find essential, may indicate a more holistic, intentional approach to learning in general.
Focus less on Training Delivery and Learning Science
This brings us to the second big difference. L&D pros in high-performing organizations focused significantly less on Training Delivery (12 percentage points less). While Training Delivery was the most important skill in L&D Core for L&D pros in other organizations, it was 5th out of 8 skills for those in high-performing organizations.
Likewise, while L&D pros mentioned Learning Science as a skill they thought they needed for the future, not one L&D professional in a high-performing organization mentioned it. Does this mean Learning Science is not necessary? Absolutely not. But it does mean that L&D functions that focus too heavily on traditional learning science, without considering the new context (technology, mindsets, motivations, etc.), may not be using their L&D development time or dollars in the best way.
Business Core
Increasingly, L&D pros consider themselves a part of the business rather than an entity that serves the business. This idea came through loud and clear in the research: L&D pros identified skills that are necessary for collaborating with other business functions.
Business Acumen and Marketing top the list for important Business Core skills, according to L&D pros.
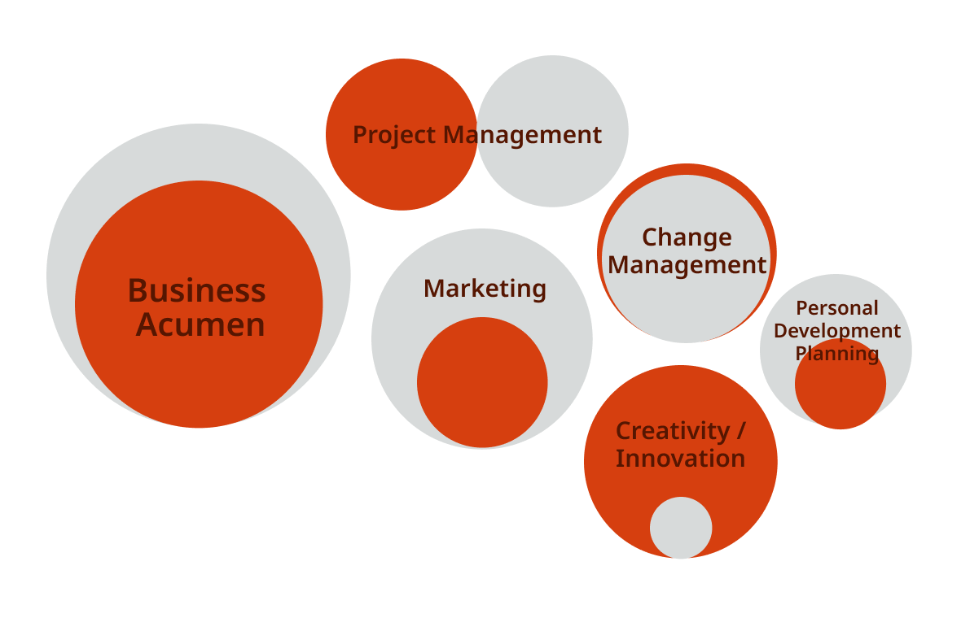
Figure 10: Business Core skills group – % of focus on each skill, n=87 | RedThread Research, 2022
Figure 10: Business Core skills group – % of focus on each skill, n=87 | RedThread Research, 2022
Among the skills mentioned in the research, Business Acumen topped the list. Leaders mentioned 3 aspects of Business Acumen.
Understanding organizational goals and strategy. L&D pros are more proactively evaluating their business direction and determining the best ways to build a skilled workforce than in previous years. Brandon Wolfram, HR Manager for Learning and Performance Solutions at SaskTel, put it this way:
We used to get more operational requests—things like, “Hey, we need some training on this topic,” or “Can you put something together on this.” Now, we get requests like, “Can you partner with us to solve this complex business challenge.
Understanding business basics. L&D functions are professionalizing. Many see themselves not as a traditional cost center but as a contributing member to business growth. As such, project management, change management, and their creativity and innovation muscles are increasingly important.
Speaking the same language. For years, L&D functions have embraced adult learning theory and the research surrounding it. While that is all good, leaders we spoke with understand the need to ditch wonky L&D terms in favor of vocabulary used more broadly.
Focusing on Business Core skills draws them into the business itself, erasing any invisible lines that may have kept them separate. These skills also make it easier to participate in larger strategic discussions.
Business Core: Blind Spots
The blind spots that L&D pros may have around this skills group come down to 2 individual skills.
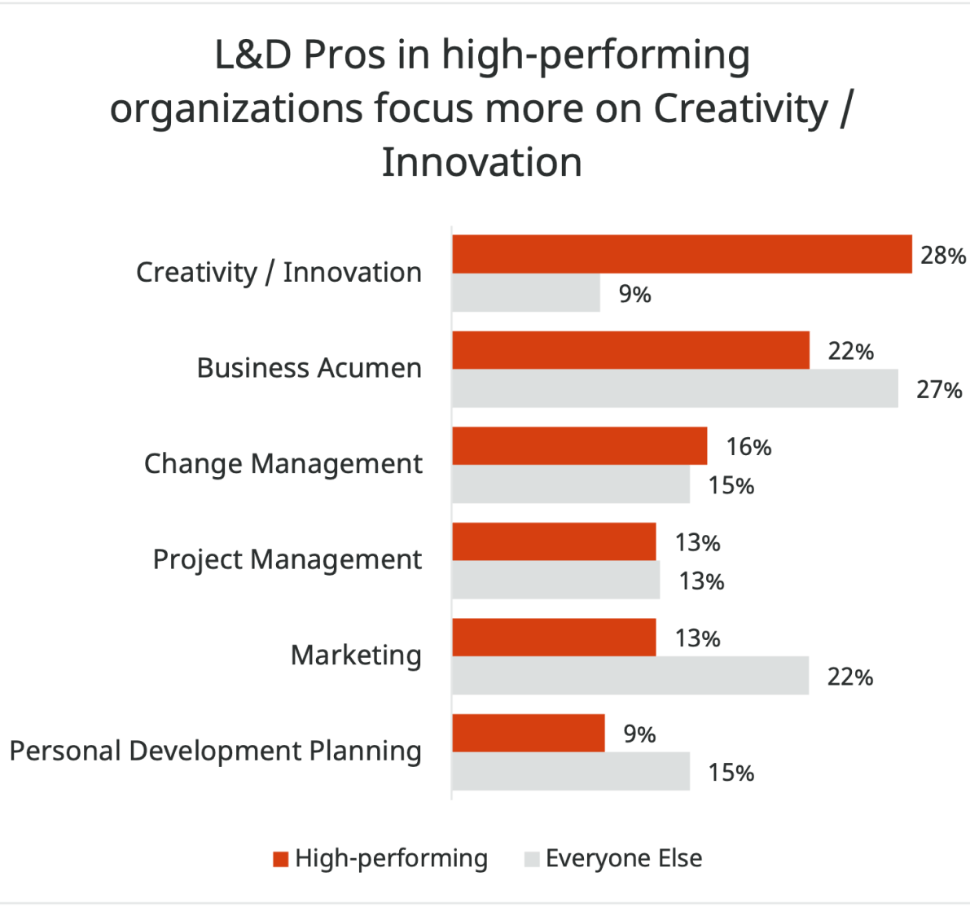
Figure 11: Business Core skills group – Focus of L&D pros in high-performing organizations vs L&D pros in other organizations. n=87 | RedThread Research, 2022
Focus more on Creativity & Innovation
First, L&D pros in high-performing organizations focus significantly more (19 percentage points more) on Creativity and Innovation than their counterparts in other organizations.
The importance of this focus in high-performing organizations aligns with what we heard from learning leaders in our interviews and roundtables. Drew Goodrich, the Director of Learning Enablement at Intuit, spoke about the importance of Creativity & Innovation for his team:
Let's get inspired by anything that’s working and done well and takes hold and gets people to do things. That's a lot more creative than just standing up PowerPoint slides or doing a breakout session—let’s get creative.
L&D pros in high-performing organizations are less likely to worship the status quo. They tend to focus on finding creative solutions to business challenges and taking more risks.
Focus less on Marketing (courses)
L&D professionals in high-performing organizations and their peers in other organizations also focus differently on Marketing.
Marketing, in this case, refers to using marketing techniques to encourage employees to participate in learning interventions. While L&D professionals in general seem to see this as a critical skill, L&D professionals in high-performing organizations were not as interested (9 percentage points less).
While it's beneficial for L&D, focusing too heavily on Marketing may indicate a fairly traditional approach to learning: “If you create an awesome course and market it the right way, they will come.”
That L&D pros in high-performing organizations are focusing so much more on Creativity & Innovation indicates that they may also be broadening their views of learning, including methods that may not be as easily “marketed” in the traditional sense.
This means that L&D pros should likely broaden “marketing” to include strategies that make all learning opportunities “discoverable.”
Managing Relationships
Several skills mentioned by L&D pros had to do with building and managing relationships. We grouped these skills into the larger skills group, Managing Relationships.
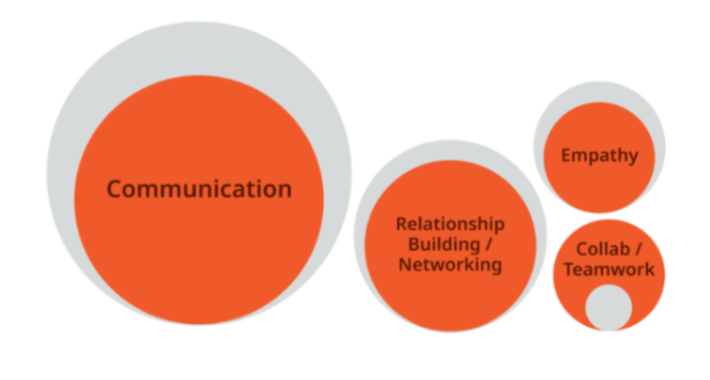
Figure 12: Managing Relationships skills group – % of focus on each skill, n=73 | RedThread Research, 2022
L&D pros who spoke with us in the roundtable and in interviews identified 3 areas where they found managing relationships crucial.
First, L&D pros found it necessary to manage the organization's relationship with L&D. Learning is an entirely voluntary activity—you can force someone to complete an e-learning course, but you can’t force them to learn the content.
L&D pros spoke of developing trust with the organization —communicating the benefits of consistent development and empathizing with employees when creating and delivering initiatives. One leader emphasized the importance of listening as a part of communication:
I think the hardest part is hearing. Not just hearing enough to fall in love with the problem, but hearing enough to solve the problem. And then creating.
Second, L&D pros increasingly see their networks and relationships with others in the organization as the key to their success. Some mentioned these relationships in the context of understanding key aspects of the business in order to meet their development needs. Others mentioned these relationships as crucial to getting things done. Relationships were crucial for tasks from understanding who to speak to in procurement to identifying the strongest SME for a specific project. Another leader said:
I’m a big believer in networking: getting to know lots of different people, and not getting too deeply dug into one particular discipline. Because if you do, you forget how all of these things are connected.
Finally, L&D pros also mentioned the need for Relationship-building and Networking as key to increasing their own knowledge and understanding. They also mentioned the need to identify the best ways to build those skills in the employee population at large.
Managing Relationships: Blind Spots
Consistent with our finding about Networking, we found that L&D pros across organizations place value on skills around Managing Relationships.
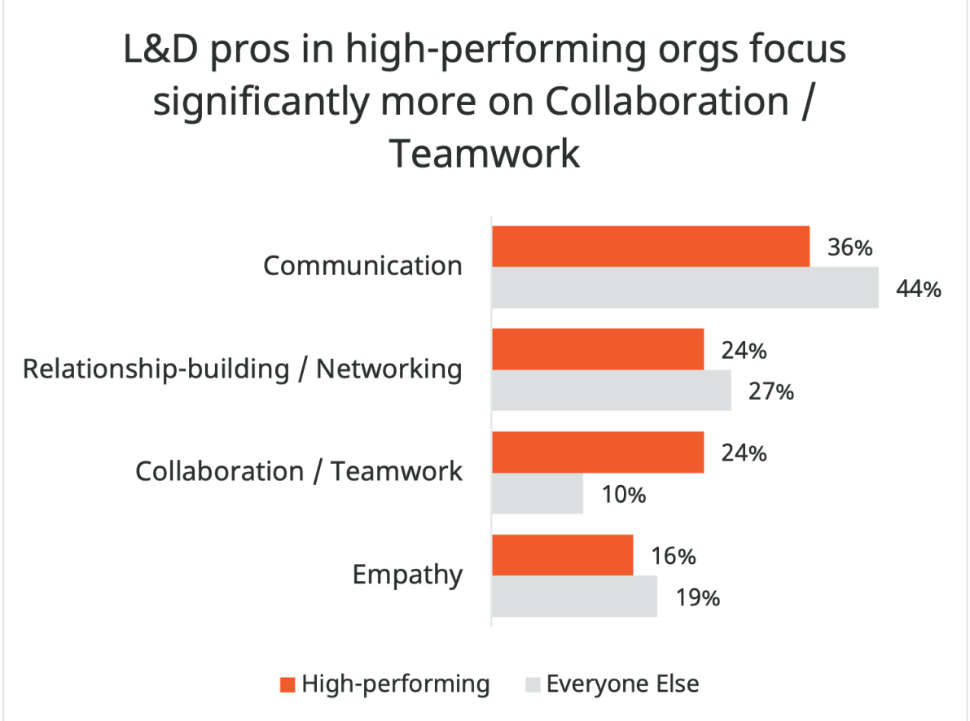
Figure 13: Managing Relationship skills focus – L&D pros in high-performing orgs vs. L&D pros in other orgs, n=73 | RedThread Research, 2022
Focus more on Collaboration & Teamwork
When we look at the focus on specific skills, however, there is a different story. Collaboration & Teamwork received significantly more attention (14 percentage points more) by L&D pros in high-performing organizations.
This focus indicates that L&D pros in these organizations realize that learning cannot just be the responsibility of the L&D function. It has to involve everyone in the organization. Drew Goodrich at Intuit says they leverage collaboration to help with strategy:
It's good there’s a lot of teamwork and collaboration and co-creation and co-planning. Getting everyone involved and getting everybody’s hands on it means you’ll actually stick to your strategy.
In essence, part of L&D's job is to deputize the organization – get everyone on the same page and build cross-functional systems that support a learning culture. That can only be done through carefully managing relationships.
Readiness
When asked, 10% of L&D pros identified Readiness skills as necessary for the future. Readiness skills are those universal skills that allow L&D functions to do their jobs in ever-changing, often chaotic circumstances. L&D pros recognized 4 skills within that category.

Figure 14: Readiness skills group – % of focus on each skill, n=67; note: n=24 for L&D pros in high-performing organizations | RedThread Research, 2022
The past couple of years have required significant change for most organizations. That need has also trickled down to L&D functions. They have had to adapt many traditional training methods to serve hybrid and remote employees. They are also being tasked with leading initiatives such as DEIB or Return to Office (likely more than once).
These changes are forcing L&D pros to be more adaptable, agile, resilient, and efficient.
The Readiness skill group the majority of them spoke of them as capabilities needed by the L&D function, not necessarily the individual. Many talked about changing mindsets, systems, and processes to make the function itself more adaptable and agile.
For example, L&D leaders mentioned they were doing things like:
- Moving away from traditional waterfall development processes and toward agile approaches, because waterfall slowed them down too much
- Recognizing the perishable nature of learning and encouraging L&D pros not to fall in love with any one solution. Thinking instead of the lifecycle of the solution and put into place evaluation triggers and plans for sunsetting or replacing them
- Adapting to immediate needs versus making sure that something is 100% perfect before launching
- Experimenting and taking risks, gathering data, and adjusting as they go instead of only measuring at the end
One leader summed up all of these ideas as she described how her L&D function was becoming more nimble:
We need to be OK with putting something out there that isn’t 100% polished, because we need to move fast. Then we see what happens. Then we need to gather feedback and adjust.
The funny thing is, we’ve been paying lip service to these skills for years. But recently, probably prompted by external events, L&D pros are doing more than just talking about them.
Readiness: Blind Spots
L&D pros from all organizations put the greatest focus on Agility in this category. They also agree that Adaptability & Flexibility are important skills. But then we see some differences.
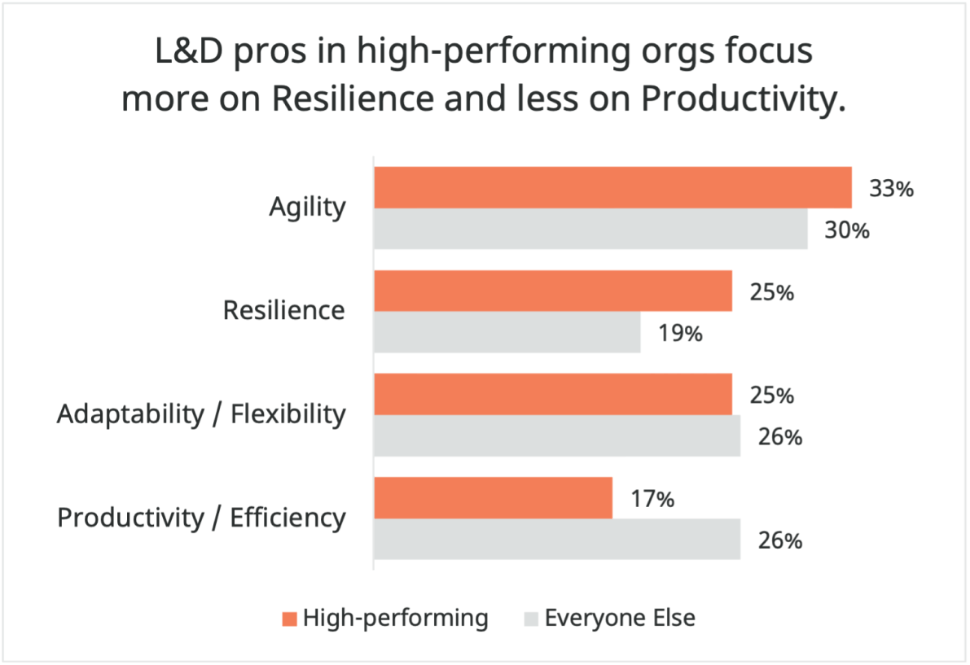
Figure 15: Readiness skills focus, L&D pros in high-performing orgs vs. L&D pros in other orgs, n=67; note: n=24 for L&D pros in high-performing organizations | RedThread Research, 2022
Focus more on Resilience
L&D pros in high-performing organizations focus on Resilience more than their peers in other organizations (7 percentage points more). The 2011 journal article “What Is Resilience?” describes Resilience as positive adaption, or the ability to maintain or regain mental health.
From our interviews and roundtable discussions, we learned that L&D leaders are looking at Resilience in 2 ways.
First, L&D leaders recognize the changes their own functions have encountered recently and understand that Resilience is key to quick adaptation.
Second, L&D pro are considering how Resilience can be taught, encouraged, and systematized within their organization so that their workforce can handle future changes and disruptions.
Focus less on Efficiency & Productivity
Interestingly, L&D pros in high-performing organizations tend to focus significantly less on Efficiency and Productivity (9 percentage points less). We’re fans of efficiency, and we think all L&D functions should strive to be more efficient and productive. But we also know that change is often messy, requiring inefficiencies and experimentation to find new and better ways of doing things.
The combination of these 2 things—greater focus on resilience and less on efficiency—likely lead to more experimental and risk-friendly environments.
L&D functions may want to consider how much respective focus they put on Resilience and learning from mistakes versus institutionalization and standardization.
Tech
Finally, Tech. Nine percent of L&D pros mentioned Tech skills when determining which skills will be needed for the Tech plays a pretty important role in the work of L&D pros, and that role appears to have been magnified as organizations were forced to adopt remote and hybrid work models.
Even before the pandemic, however, L&D pros saw tech as a way to engage, scale, personalize, evaluate, and quantify learning. Organizations had also started to move toward a digital mindset. As organizations have begun to adopt skills a skills mindset, tech has only become more critical.
L&D pros identified tech skills in basically 2 flavors, as shown in Figure 16.
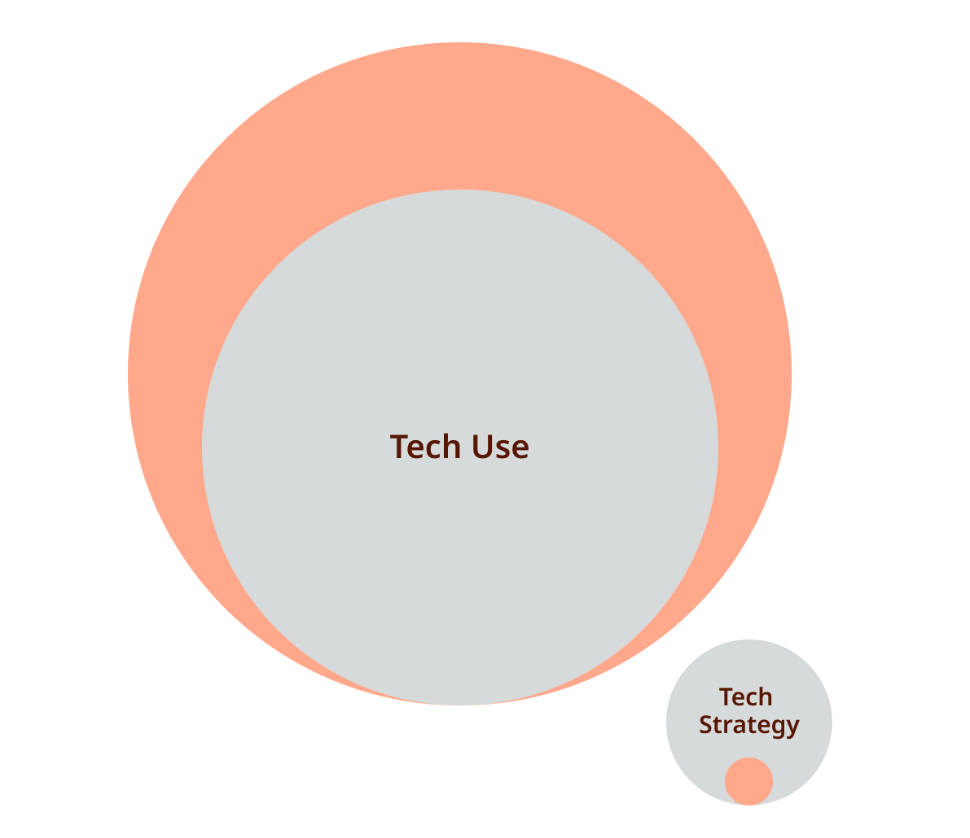
Figure 16: Tech skills group – % of focus on each skill, n=60; note: n=14 for L&D pros in high-performing organizations | RedThread Research, 2022
L&D pros overwhelmingly identified skills related to using tech more effectively in their roles. In fact, Tech Use was the second most mentioned skill overall—second only to Data Analysis. However, we want to note some nuances in the interviews that we feel are important.
First, L&D pros mentioned that as their organizations have fully embraced hybrid and remote work, many employees lack the skills necessary to work in these environments effectively. Karen Dowdall-Sanford, Senior Director of L&D at Flyhomes put it like this:
Once again, there’s a skill set specific to virtual collaboration and how you use Teams or Slack effectively. There’s the technical skill set of just understanding the tool, but then there are also norms and practices and behaviors that run into how to do it effectively.
L&D pros appear to understand that they need skills to help others develop skills in virtual collaboration—something we think we’ll see more of.
Second, some L&D pros mentioned 2 skill sets that fall under tech use. First, a skill set needed to use the tech effectively. Second, a skill set associated with creating the right environment around that tech. Tech that doesn’t integrate with the organization doesn’t work. Mitchel McNair, Global Learning & Career Consultant at Dow, said it like this:
We’re doing some things in technology, but the huge technology piece is probably the easiest piece. The bigger challenge is the culture and processes and L&D work design.
The other piece of the Tech skills group is Tech Strategy. Tech Strategy focuses less on the skills needed to use individual technologies and more on how the technologies work together to create the experience.
Tech Strategy often involves tech outside of the L&D function, such as tech that is leveraged from other business functions. (Teams and Slack are good examples).
A strong tech strategy also identifies places of intersection with other business tech and ensures that the learning tech roadmap aligns with the vision of the larger organization.
Tech: Blind Spots
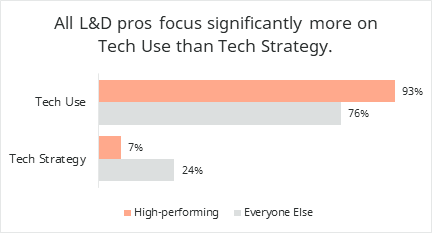
Figure 17: Tech skills focus, L&D pros in high-performing orgs vs. L&D pros in other orgs, n=60 note: n=14 for L&D pros in high-performing organizations | RedThread Research, 2022
Focus more on Tech Strategy
None of our research indicated much difference between the focus of L&D pros in high-performing organizations versus those in other organizations. All L&D pros focused heavily on Tech Use.
Frankly, we wish we had an explanation for this, as we expected to find the opposite. However, it looks like high-performing organizations are still, as are most talented L&D pros, thinking about what the tech can do and less about how it fits together.
Therefore, the blind spot associated with technology is common to all L&D pros, regardless of their organization’s performance. All L&D pros should focus more time and effort on creating the experience, including determining how technology pieces fit together, the overall technology strategy, and how it aligns with the organization’s tech strategy.
Wrap Up: Upskill, L&D
Undoubtedly, organizations are focusing on upskilling their workforces. And, undoubtedly, L&D pros have a big role to play in that effort. Exciting times are ahead, but L&D pros need to be prepared.
To use a well-known metaphor, L&D pros are sitting in an airplane experiencing some turbulence. The oxygen masks have dropped, and L&D needs to take the time to put theirs on first before ensuring that employees get theirs on as well.
So upskill, L&D. We learned a lot in this study about where L&D pros should focus their efforts. Knowing is half the battle. The other half – making the time and actually doing the development – is the harder part, but we think crucial to the continued efficacy of L&D functions everywhere.
Note: for Appendices, including skills definitions, study demographics, research methodology, and contributors please download the PDF report.
Learning Content: Making Sense of the Chaos (Webinar Slides)
Posted on Tuesday, March 22nd, 2022 at 6:26 AM
These days, there’s learning content everywhere—inside and outside orgs; online and offline; in learning systems, email, chat platforms; and more. It’s chaos.
L&D functions must help employees navigate the chaos to find the content they need. They can start to do this by asking 2 questions about their learning content:
- How specific is the content to my org?
- How long is the content’s shelf life?
In this session, Dani Johnson and Heather Gilmartin Adams explored these 2 questions and presented RedThread’s latest research on learning content. Participants:
- Learned about current trends in content
- Explored a model that can inform a solid learning content strategy
- Saw how forward-thinking orgs are addressing common learning content challenges
Putting Purpose in Your Leadership Pipeline
Posted on Tuesday, March 15th, 2022 at 12:56 PM
Organizations focused on purpose are outperforming their peers in recruiting, retention and business performance. Yet, many leaders struggle to do this well. So how can organizations help leaders at all levels focus on purpose? You’ll learn how in this session as Stacia Garr shares RedThread’s latest insights on how to reframe and understand organizational purpose, how to help leaders lead with and reinforce purpose, and how to develop new leaders to take on this important responsibility.
L&D’s Opportunity to Move beyond Diversity Training
Posted on Thursday, February 24th, 2022 at 7:52 PM
Organizations are investing more than ever in diversity, equity, inclusion, and belonging (DEIB) efforts. We see an opportunity for L&D functions to do the same, beyond simple diversity training. With their influence on culture and reach across the enterprise, L&D functions are well-positioned to improve the DEIB culture in their organizations.
And L&D functions want to do more on DEIB. In LinkedIn Learning’s 2021 Workplace Learning Report, 64% of L&D professionals globally and 73% in North America said DEIB programs were a priority. Our own experience tracks with this trend: RedThread community members are asking more and more about DEIB and learning.
But L&D functions seem to struggle to identify the best ways to help. That’s why we launched a research study focusing on this question:
What are the most impactful things L&D functions can do to help build a robust DEIB culture in their organizations?
To get a grasp on the current DEIB and learning conversation, we reviewed nearly 100 articles, books, podcasts, and reports. We expected, frankly, to find a lot about diversity training and not much else. And, as expected, there was a lot about diversity training. But there were more interesting ideas, too.
This short article summarizes the key ideas we found, including:
- 4 themes from the literature
- 1 hidden gem
- 5 articles that caught our attention
- 6 additional articles to check out if you have time
What we found: 4 themes from the literature
The literature has lots of ideas about DEIB and learning. These ideas fell into 4 themes:
- L&D is tangential to the DEIB conversation
- L&D is focused on improving diversity training
- Developing underrepresented groups is a common DEIB strategy
- L&D functions need to take a hard look at themselves
L&D is tangential to the DEIB conversation
In the literature we reviewed, DEIB or org psych professionals sometimes wrote about diversity training or unconscious bias programs. But not many L&D professionals ventured into the broader DEIB conversation.
Additionally, a few studies we ran across revealed that L&D functions are on the periphery of DEIB efforts. In one survey by i4cp, only 25% of respondents said L&D is “heavily tasked” with efforts to improve diversity and inclusion goals.
Many articles noted that L&D and DEIB teams often do not work together as closely or as effectively as they could. As a result, L&D functions are sometimes left out of key DEIB strategy, goal-setting, and planning decisions. These pieces argued that if L&D functions want to do more on DEIB, they need to partner better with stakeholders across the business. For example, Matthew Daniel, principal at Guild Education, wrote:
"Rather than siloing objectives onto separate teams, CLOs and CDOs can accomplish more by working together, while also measuring and tracking progress at the same time."
Other pieces echoed Daniel’s point about measuring and tracking progress. They suggested that L&D functions should know how success on DEIB is defined, tracked, and measured in their organization. Then, they said, L&D should align the learning strategy to those goals and metrics.
L&D is focused on improving diversity training
We expected to see many articles arguing that compliance-focused, event-based DEIB training doesn’t work. And there were lots of articles about diversity and unconscious bias training. To our surprise, however, these articles took the ineffectiveness of these training programs as a given. They often cited the 2016 article, “Why Diversity Programs Fail,” as proof.
There were 2 broad threads in this portion of the literature:
- Training effectiveness: Ideas about making diversity training more effective in changing employee behavior. For example, articles mentioned using AR / VR simulations to encourage empathy and help employees practice skills.
- Inclusivity: Suggestions for making all training (especially diversity training) more inclusive. For example, the literature suggested soliciting diverse perspectives when designing training and content.
Some articles did explore additional learning methods that might be used to develop employees’ DEIB skills. Of these, many mentioned coaching managers on being more inclusive leaders. Others discussed microlearning and “nudges” that space learning over time. But these articles did not explore ways for L&D functions to improve DEIB outside of creating learning programs.
Developing underrepresented groups is a common DEIB strategy
The literature agreed that organizations should develop individuals from underrepresented groups. As one study by McKinsey pointed out, employees in underrepresented groups report having fewer development opportunities than other employees. Several articles argued that active and intentional support of underrepresented groups could help reduce this gap.
The literature also noted that employees from underrepresented groups are more likely to use and benefit from structured programs. There were many ideas about programs that might enable these employees to develop and advance. Some of the ideas mentioned included:
- Employee Resource Groups (ERGs)
- Work-study programs
- Apprenticeships
- Work assignments (e.g., international postings)
- Rotational schemes
- Tuition reimbursement
- Talent marketplaces (to enhance visibility and access to opportunities)
- Intrapreneurship programs
- Communities of practice
- “People advisors” who provide career coaching
- Mentoring and sponsorship
- Coaching
In reviewing this theme, we noticed a disconnect: Many articles pushed for more development of underrepresented groups. But others noted that L&D isn’t heavily responsible for DEIB efforts (as we saw in the first theme of this review).
These threads seem contradictory. If developing underrepresented groups is so important, why isn’t L&D more central to DEIB strategies? The literature didn’t answer this question directly. But it’s interesting to note that many of the above programs aren’t traditionally L&D’s responsibility (e.g., rotations, ERGs). We think that may be the reason so many authors emphasized the need for L&D functions to partner with key stakeholders, as mentioned above.
L&D functions need to take a hard look at themselves
A few articles in the literature asked L&D functions to do some serious self-reflection. They are not the bulk of the literature—not by a long shot. But we are calling them out as a theme because they highlighted an issue with substantial DEIB implications: L&D’s own lack of diversity. These articles—especially the ones from authors Gena Cox and Katy Peters, Ave Rio, and Maria Morukian—noted that most L&D functions are majority white and majority women (except at senior levels). Most L&D professionals hold advanced degrees. That means:
White women with advanced degrees dominate L&D. At more senior levels, white men with advanced degrees do.
According to these articles, non-diverse L&D functions might find it harder to drive DEIB efforts and make employee development more diverse, equitable, and inclusive. For example, some articles noted that a lack of diversity might allow bias to creep into the ways that L&D functions tend to:
- Define, prioritize, and measure skills, aptitude, and abilities
- Use data to make decisions about learning
- Decide which development opportunities to offer
- Choose learning methods to invest in
These articles explored how the L&D function might need to change itself to address potential biases. They are a great start to a broader conversation about all the ways L&D functions can contribute to DEIB efforts in their organizations.
Hidden gem: A systems approach to DEIB and learning
We found a handful of articles that took a systemic view of how L&D functions might influence DEIB. They thought more broadly about how to make learning more equitable and inclusive, rather than just about the programs L&D functions might create.
J.D. Dillon, CEO of learning vendor Axonify, wrote:
"Restoring learning equity requires a fundamental mindset shift. Rather than relying on programs as the basic unit of learning, professionals should adopt a systems approach."
By a “systems approach,” these articles meant looking at things like accessibility and opportunity:
- Who is offered access to development opportunities, and why?
- How might access to development opportunities vary based on an employee’s location, access to tech, or ability to use nonworking hours for development?
- Are learning opportunities easy for all employees to find? Are they widely and effectively marketed to all employees?
We appreciated these prompts to think about how L&D functions can ensure that all employees have equitable access to development opportunities. And we believe a systemic lens will reveal many additional ways that L&D functions can make learning more diverse, equitable, and inclusive. We plan to investigate this systemic approach in more depth as part of this research.
What caught our attention
Of the literature we reviewed, several pieces stood out to us. Each of the articles below contained information that we found helpful and / or intriguing. We learned from their perspectives and encourage you to do the same. Click on the titles to go to the full articles.
Advance DEI Using Talent Development Expertise
"The biggest opportunities for TD professionals to make a difference lie in three important but often overlooked segments: knowledge management, career and leadership development, and coaching."
This article has detailed, practical advice for L&D professionals who want to do more on DEIB, above and beyond DEIB training. It also has some great examples of what good looks like—and what good doesn’t look like.
Highlights
- Training courses are one part, but not the cornerstone, of a strong DEIB strategy.
- L&D functions can use their knowledge management expertise to make tacit DEIB knowledge more explicit, storable, and shareable.
- Inclusive, equitable employee development programs require DEIB and L&D staff to work together.
- Coaching can build more diverse, inclusive, and equitable workplaces by equipping managers with DEIB skills.
L&D’s DEI Blind Spot: Perpetuating Inequity?
Gena Cox and Katy Peters
"What if the L&D professionals who measure achievement of… skills understand the day-to-day experience of only a subset of their colleagues? What if the career progression decisions from those measurements perpetuate some of the same distorted effects that are now evident in educational assessment?"
This article examines how L&D’s potential biases and blind spots might lead to inequitable employee development. It makes a case for a proactive, systemic approach to overcoming those biases.
Highlights
- The L&D profession lacks racial and ethnic diversity, potentially leading to blind spots, biases, and inequity.
- The way skills are currently defined, prioritized, and measured may lead to biased outcomes.
- Overcoming L&D’s blind spots requires a systemic approach that re-examines many long-standing L&D practices, including how skills are defined and how data are used.
- A proactive approach to addressing L&D’s blind spots will help make workplaces more inclusive.
Mapping Exclusion in the Organization
Inga Carboni, Andrew Parker, and Nan S. Langowitz
"Our research made clear that who you know is as important—often more so—than what you know when it comes to rising through the ranks."
Organizational network analysis (ONA) can reveal who knows whom. It can uncover who has access to informal networks and sources of info about development opportunities. Using ONA, L&D functions can also identify marginalized groups who can be invited for specific development.
Highlights
- One study revealed that men’s informal relationships with their male managers could explain nearly 40% of the gender pay gap.
- Women are less likely to be at the center of the networks that matter: knowledge, innovation, and critical decision-making networks.
- L&D functions can impact DEIB by codifying and sharing the networking strategies of people with solid and diverse networks.
- L&D functions can use ONA to assess the effectiveness of specific diversity training and other learning programs.
L&D’s Diversity Dilemma
"‘Here we are in Taiwan, in Asia, where they were doing training and learning way before the US, and the two major keynoters they got were white guys over 60 from New York,’ Masie said."
This article is packed with quotes from L&D and DEIB experts. These experts explain why L&D functions must reflect the employee population in terms of race, ethnicity, gender, background, etc.
Highlights
- The number of people of color in L&D does not reflect the communities L&D serves.
- L&D functions are often asked to be the ambassadors of organizational culture, which is difficult if they aren’t representative of the workforce.
- Thought leaders in L&D are often older white men, reflecting the people who pioneered the field in the 1960s and 1970s.
- To increase diversity, L&D functions need to be intentionally inclusive about whom they highlight as thought leaders.
- L&D’s role in DEIB must be part of a larger organizational strategy.
Getting the Most from Your Diversity Dollars
Jennifer Garcia-Alonso, Matt Krentz, Claire Tracey, and Miki Tsusaka
"When asked if their company offers support for women from executives and middle managers, 72% of male respondents say yes, compared with only 54% of women."
This report helps companies identify the specific diversity and inclusion initiatives—including learning initiatives—that offer the greatest payoff for gender equity. It breaks initiatives into 4 helpful categories: Proven Measures, Hidden Gems, Baseline Measures, and Overrated Measures.
Highlights
- Proven measures are valued by women and known to be effective by leaders. For example, a proven measure related to L&D is sponsoring women at scale.
- Hidden gems are highly effective initiatives that many organizations should pursue. For example, a hidden gem related to L&D is offering professional development for underrepresented groups.
- Baseline measures are basic steps that all organizations should do, but that don’t have a transformative effect on women’s daily experience. For example, a baseline measure related to L&D is mentoring women.
- Overrated measures are seemingly promising efforts that often do not lead to real cultural change. For example, an overrated measure related to L&D is one-time diversity training sessions.
Additional articles to check out
- "Are learning equity issues affecting your company?" J.D. Dillon, TD Magazine, 2021.
- Improving Workplace Culture through Evidence-Based Diversity, Equity, and Inclusion Practices, S. Creary, N. Rothbard, and J. Scruggs, The Wharton School of the University of Pennsylvania, 2021.
- "How internal talent marketplaces can help overcome seven common DEI strategy pitfalls," M. Heiskell, D. Kearns-Manolatos, and M. Rawat, Deloitte, 2021.
- "Assignments are critical tools to achieve workplace gender equity," E. Macke, G. Gall Rosa, S. Gilmartin, and C. Simard, MIT Sloan Management Review, 2022.
- "How does your company support ‘first-generation professionals’?" M. Burwell and B. Maldonaldo, SHRM, 2022.
- "Providing performance feedback to support neurodiverse employees," M. Hamdani and S. Biagi, MIT Sloan Management Review, 2022.