L&D’s Opportunity to Move beyond Diversity Training
Posted on Thursday, February 24th, 2022 at 7:52 PM
Organizations are investing more than ever in diversity, equity, inclusion, and belonging (DEIB) efforts. We see an opportunity for L&D functions to do the same, beyond simple diversity training. With their influence on culture and reach across the enterprise, L&D functions are well-positioned to improve the DEIB culture in their organizations.
And L&D functions want to do more on DEIB. In LinkedIn Learning’s 2021 Workplace Learning Report, 64% of L&D professionals globally and 73% in North America said DEIB programs were a priority. Our own experience tracks with this trend: RedThread community members are asking more and more about DEIB and learning.
But L&D functions seem to struggle to identify the best ways to help. That’s why we launched a research study focusing on this question:
What are the most impactful things L&D functions can do to help build a robust DEIB culture in their organizations?
To get a grasp on the current DEIB and learning conversation, we reviewed nearly 100 articles, books, podcasts, and reports. We expected, frankly, to find a lot about diversity training and not much else. And, as expected, there was a lot about diversity training. But there were more interesting ideas, too.
This short article summarizes the key ideas we found, including:
- 4 themes from the literature
- 1 hidden gem
- 5 articles that caught our attention
- 6 additional articles to check out if you have time
What we found: 4 themes from the literature
The literature has lots of ideas about DEIB and learning. These ideas fell into 4 themes:
- L&D is tangential to the DEIB conversation
- L&D is focused on improving diversity training
- Developing underrepresented groups is a common DEIB strategy
- L&D functions need to take a hard look at themselves
L&D is tangential to the DEIB conversation
In the literature we reviewed, DEIB or org psych professionals sometimes wrote about diversity training or unconscious bias programs. But not many L&D professionals ventured into the broader DEIB conversation.
Additionally, a few studies we ran across revealed that L&D functions are on the periphery of DEIB efforts. In one survey by i4cp, only 25% of respondents said L&D is “heavily tasked” with efforts to improve diversity and inclusion goals.
Many articles noted that L&D and DEIB teams often do not work together as closely or as effectively as they could. As a result, L&D functions are sometimes left out of key DEIB strategy, goal-setting, and planning decisions. These pieces argued that if L&D functions want to do more on DEIB, they need to partner better with stakeholders across the business. For example, Matthew Daniel, principal at Guild Education, wrote:
"Rather than siloing objectives onto separate teams, CLOs and CDOs can accomplish more by working together, while also measuring and tracking progress at the same time."
Other pieces echoed Daniel’s point about measuring and tracking progress. They suggested that L&D functions should know how success on DEIB is defined, tracked, and measured in their organization. Then, they said, L&D should align the learning strategy to those goals and metrics.
L&D is focused on improving diversity training
We expected to see many articles arguing that compliance-focused, event-based DEIB training doesn’t work. And there were lots of articles about diversity and unconscious bias training. To our surprise, however, these articles took the ineffectiveness of these training programs as a given. They often cited the 2016 article, “Why Diversity Programs Fail,” as proof.
There were 2 broad threads in this portion of the literature:
- Training effectiveness: Ideas about making diversity training more effective in changing employee behavior. For example, articles mentioned using AR / VR simulations to encourage empathy and help employees practice skills.
- Inclusivity: Suggestions for making all training (especially diversity training) more inclusive. For example, the literature suggested soliciting diverse perspectives when designing training and content.
Some articles did explore additional learning methods that might be used to develop employees’ DEIB skills. Of these, many mentioned coaching managers on being more inclusive leaders. Others discussed microlearning and “nudges” that space learning over time. But these articles did not explore ways for L&D functions to improve DEIB outside of creating learning programs.
Developing underrepresented groups is a common DEIB strategy
The literature agreed that organizations should develop individuals from underrepresented groups. As one study by McKinsey pointed out, employees in underrepresented groups report having fewer development opportunities than other employees. Several articles argued that active and intentional support of underrepresented groups could help reduce this gap.
The literature also noted that employees from underrepresented groups are more likely to use and benefit from structured programs. There were many ideas about programs that might enable these employees to develop and advance. Some of the ideas mentioned included:
- Employee Resource Groups (ERGs)
- Work-study programs
- Apprenticeships
- Work assignments (e.g., international postings)
- Rotational schemes
- Tuition reimbursement
- Talent marketplaces (to enhance visibility and access to opportunities)
- Intrapreneurship programs
- Communities of practice
- “People advisors” who provide career coaching
- Mentoring and sponsorship
- Coaching
In reviewing this theme, we noticed a disconnect: Many articles pushed for more development of underrepresented groups. But others noted that L&D isn’t heavily responsible for DEIB efforts (as we saw in the first theme of this review).
These threads seem contradictory. If developing underrepresented groups is so important, why isn’t L&D more central to DEIB strategies? The literature didn’t answer this question directly. But it’s interesting to note that many of the above programs aren’t traditionally L&D’s responsibility (e.g., rotations, ERGs). We think that may be the reason so many authors emphasized the need for L&D functions to partner with key stakeholders, as mentioned above.
L&D functions need to take a hard look at themselves
A few articles in the literature asked L&D functions to do some serious self-reflection. They are not the bulk of the literature—not by a long shot. But we are calling them out as a theme because they highlighted an issue with substantial DEIB implications: L&D’s own lack of diversity. These articles—especially the ones from authors Gena Cox and Katy Peters, Ave Rio, and Maria Morukian—noted that most L&D functions are majority white and majority women (except at senior levels). Most L&D professionals hold advanced degrees. That means:
White women with advanced degrees dominate L&D. At more senior levels, white men with advanced degrees do.
According to these articles, non-diverse L&D functions might find it harder to drive DEIB efforts and make employee development more diverse, equitable, and inclusive. For example, some articles noted that a lack of diversity might allow bias to creep into the ways that L&D functions tend to:
- Define, prioritize, and measure skills, aptitude, and abilities
- Use data to make decisions about learning
- Decide which development opportunities to offer
- Choose learning methods to invest in
These articles explored how the L&D function might need to change itself to address potential biases. They are a great start to a broader conversation about all the ways L&D functions can contribute to DEIB efforts in their organizations.
Hidden gem: A systems approach to DEIB and learning
We found a handful of articles that took a systemic view of how L&D functions might influence DEIB. They thought more broadly about how to make learning more equitable and inclusive, rather than just about the programs L&D functions might create.
J.D. Dillon, CEO of learning vendor Axonify, wrote:
"Restoring learning equity requires a fundamental mindset shift. Rather than relying on programs as the basic unit of learning, professionals should adopt a systems approach."
By a “systems approach,” these articles meant looking at things like accessibility and opportunity:
- Who is offered access to development opportunities, and why?
- How might access to development opportunities vary based on an employee’s location, access to tech, or ability to use nonworking hours for development?
- Are learning opportunities easy for all employees to find? Are they widely and effectively marketed to all employees?
We appreciated these prompts to think about how L&D functions can ensure that all employees have equitable access to development opportunities. And we believe a systemic lens will reveal many additional ways that L&D functions can make learning more diverse, equitable, and inclusive. We plan to investigate this systemic approach in more depth as part of this research.
What caught our attention
Of the literature we reviewed, several pieces stood out to us. Each of the articles below contained information that we found helpful and / or intriguing. We learned from their perspectives and encourage you to do the same. Click on the titles to go to the full articles.
Advance DEI Using Talent Development Expertise
"The biggest opportunities for TD professionals to make a difference lie in three important but often overlooked segments: knowledge management, career and leadership development, and coaching."
This article has detailed, practical advice for L&D professionals who want to do more on DEIB, above and beyond DEIB training. It also has some great examples of what good looks like—and what good doesn’t look like.
Highlights
- Training courses are one part, but not the cornerstone, of a strong DEIB strategy.
- L&D functions can use their knowledge management expertise to make tacit DEIB knowledge more explicit, storable, and shareable.
- Inclusive, equitable employee development programs require DEIB and L&D staff to work together.
- Coaching can build more diverse, inclusive, and equitable workplaces by equipping managers with DEIB skills.
L&D’s DEI Blind Spot: Perpetuating Inequity?
Gena Cox and Katy Peters
"What if the L&D professionals who measure achievement of… skills understand the day-to-day experience of only a subset of their colleagues? What if the career progression decisions from those measurements perpetuate some of the same distorted effects that are now evident in educational assessment?"
This article examines how L&D’s potential biases and blind spots might lead to inequitable employee development. It makes a case for a proactive, systemic approach to overcoming those biases.
Highlights
- The L&D profession lacks racial and ethnic diversity, potentially leading to blind spots, biases, and inequity.
- The way skills are currently defined, prioritized, and measured may lead to biased outcomes.
- Overcoming L&D’s blind spots requires a systemic approach that re-examines many long-standing L&D practices, including how skills are defined and how data are used.
- A proactive approach to addressing L&D’s blind spots will help make workplaces more inclusive.
Mapping Exclusion in the Organization
Inga Carboni, Andrew Parker, and Nan S. Langowitz
"Our research made clear that who you know is as important—often more so—than what you know when it comes to rising through the ranks."
Organizational network analysis (ONA) can reveal who knows whom. It can uncover who has access to informal networks and sources of info about development opportunities. Using ONA, L&D functions can also identify marginalized groups who can be invited for specific development.
Highlights
- One study revealed that men’s informal relationships with their male managers could explain nearly 40% of the gender pay gap.
- Women are less likely to be at the center of the networks that matter: knowledge, innovation, and critical decision-making networks.
- L&D functions can impact DEIB by codifying and sharing the networking strategies of people with solid and diverse networks.
- L&D functions can use ONA to assess the effectiveness of specific diversity training and other learning programs.
L&D’s Diversity Dilemma
"‘Here we are in Taiwan, in Asia, where they were doing training and learning way before the US, and the two major keynoters they got were white guys over 60 from New York,’ Masie said."
This article is packed with quotes from L&D and DEIB experts. These experts explain why L&D functions must reflect the employee population in terms of race, ethnicity, gender, background, etc.
Highlights
- The number of people of color in L&D does not reflect the communities L&D serves.
- L&D functions are often asked to be the ambassadors of organizational culture, which is difficult if they aren’t representative of the workforce.
- Thought leaders in L&D are often older white men, reflecting the people who pioneered the field in the 1960s and 1970s.
- To increase diversity, L&D functions need to be intentionally inclusive about whom they highlight as thought leaders.
- L&D’s role in DEIB must be part of a larger organizational strategy.
Getting the Most from Your Diversity Dollars
Jennifer Garcia-Alonso, Matt Krentz, Claire Tracey, and Miki Tsusaka
"When asked if their company offers support for women from executives and middle managers, 72% of male respondents say yes, compared with only 54% of women."
This report helps companies identify the specific diversity and inclusion initiatives—including learning initiatives—that offer the greatest payoff for gender equity. It breaks initiatives into 4 helpful categories: Proven Measures, Hidden Gems, Baseline Measures, and Overrated Measures.
Highlights
- Proven measures are valued by women and known to be effective by leaders. For example, a proven measure related to L&D is sponsoring women at scale.
- Hidden gems are highly effective initiatives that many organizations should pursue. For example, a hidden gem related to L&D is offering professional development for underrepresented groups.
- Baseline measures are basic steps that all organizations should do, but that don’t have a transformative effect on women’s daily experience. For example, a baseline measure related to L&D is mentoring women.
- Overrated measures are seemingly promising efforts that often do not lead to real cultural change. For example, an overrated measure related to L&D is one-time diversity training sessions.
Additional articles to check out
- "Are learning equity issues affecting your company?" J.D. Dillon, TD Magazine, 2021.
- Improving Workplace Culture through Evidence-Based Diversity, Equity, and Inclusion Practices, S. Creary, N. Rothbard, and J. Scruggs, The Wharton School of the University of Pennsylvania, 2021.
- "How internal talent marketplaces can help overcome seven common DEI strategy pitfalls," M. Heiskell, D. Kearns-Manolatos, and M. Rawat, Deloitte, 2021.
- "Assignments are critical tools to achieve workplace gender equity," E. Macke, G. Gall Rosa, S. Gilmartin, and C. Simard, MIT Sloan Management Review, 2022.
- "How does your company support ‘first-generation professionals’?" M. Burwell and B. Maldonaldo, SHRM, 2022.
- "Providing performance feedback to support neurodiverse employees," M. Hamdani and S. Biagi, MIT Sloan Management Review, 2022.
Putting Purpose in Your Leadership Pipeline
Posted on Tuesday, February 22nd, 2022 at 6:17 PM
How is it already the last week of February?! Hard to believe. That means, though, that the Spring HR Tech show is next week, and I will be sharing a keynote on March 3, 4:45 pm PT, Putting Purpose in Your Leadership Pipeline. We will be following this up with a new report.
Since I’ve been thinking about this topic a lot, I thought I’d give you a bit of the behind-the-scenes on the talk. When I began preparing, I thought the talk and report would be all about the cool ways HR was helping leaders learn, develop, and reinforce their purpose. Rest assured, there is plenty of that in the talk. However, I quickly realized that a focus on what HR can do wasn’t going to actually help leaders prioritize purpose.
Instead, after conversations with several non-HR leaders, I realized that the most significant barrier to leaders prioritizing purpose was how they perceived purpose. Many leaders see a focus on purpose as, at worst, a distraction from their business, and at best, an HR fad designed to help address “The Great Resignation.”
The need for purpose is more fundamental than either of those things. Here are just a few stats (from Just Capital) from the talk that make this point clearly:
- 58% of Americans believe the current form of capitalism is NOT working for average Americans
- 51% of Americans believe companies are NOT having a positive impact on society overall
- 47% of Americans believe companies are going in the wrong direction
Having an organizational purpose is tied closely to serving all stakeholders:
- Employees
- Customers
- Suppliers
- Communities
- Shareholders
If leaders can effectively adopt or refine a clear purpose that enables them to serve and address the needs of all those stakeholders, they may be able to stem the tides of discontent so many feel. Organizational purpose is about making organizations work for everyone.
But how do we help leaders adjust their understanding of purpose? Well, that is what the talk is about! We have a P&L-driven way to help leaders re-think purpose, and we follow that up with some CEO-led examples from PepsiCo, EY, and The Home Depot.
I sincerely hope you join us for the talk—it’s free!—and check out our research report once it comes out. Until then, I hope you have a purposeful week.
Bringing it All Together: Glint to Integrate with Microsoft Viva
Posted on Friday, February 18th, 2022 at 6:53 PM
One year and 2 weeks ago Microsoft launched their employee experience offering, Viva. We wrote about it back then and explained why it was a big deal for the HR tech market. Yesterday, Microsoft announced that it will transition Glint, an employee engagement solution, from LinkedIn (acquired Glint in 2018) to become a core part of Viva. The company is set to bring Glint completely into Viva in 2023.
Keeping up with the momentum from 2021, the HR tech market continues to provide us with a show in 2022.
Just last week we wrote about Perceptyx, another employee engagement and experience vendor, acquiring Cultivate, a digital coaching tool, and further enhancing its listening capabilities. While the news of Glint integrating into Viva is not nearly as surprising and market shifting (Glint was already integrating into one of the Viva modules as a partner and providing joint customers access to their analytics insights), it is still notable for a few reasons, not least of them being that it makes Viva a serious player in the analytics space.
Before we dive into the details of what this means for the customers, to Glint, Microsoft, and the HR tech market, let’s do a quick recap of what is Microsoft Viva.
What is Microsoft Viva?
Built on top of Microsoft 365 and Teams, Viva is an employee experience solution that offers four modules (see Figure 1), which combine existing Microsoft offerings into a single solution:
-
- Connections – Creates a “digital campus” where all policy, benefits, communities, and other centralized resources are available.
- Insights –Provides employees with insights on how they work, and gives managers and leaders information about their teams, burnout risk, after-hours work, etc
- Topics – Leverages Project Cortex to identify knowledge and experts across the organization, generating topic cards, topic pages, and knowledge centers (including people – not just information) for others to access – a “Wikipedia of people and information” for the org.
- Learning – Integrates LinkedIn Learning (formerly Lynda.com), Microsoft Learn, and other external sources (including LMSs or LXPs such as Cornerstone and Skillsoft) into a single location within Microsoft.

Figure 1: Summary of Microsoft Viva | Source: Glint, 2021.
When Microsoft launched Viva 1 year ago, Glint was integrating into the “Insights” module of their offering as a partner. It was providing analytics, based on combined data from Viva and Glint to the users by via Power BI dashboards in Viva for Microsoft customers and pulling Viva data into their own dashboards for Glint customers. In the near future, Glint will be completely integrated into the core Viva offering, meaning customers should be able to access insights in the tools where they work, i.e., Teams.
Let’s break this down and find out what it means for everyone involved.
What does it mean for the customers?
Overall, this should be good news for both Glint and Microsoft customers for a few reasons.
- Customers should be able to access employee insights more seamlessly. Currently, customers need to have both Viva insights and Glint, in order to access insights based on a combination of employee perception (Glint) and behavioral data (Viva insights) through dashboards in Viva or Glint. Once Glint is integrated into Viva, customers should allow users to receive these insights more easily and quickly.
- The annual engagement survey from Microsoft will be moved over to Glint and called “Employee Signals” to reflect a more continuous, always-on listening approach. This should allow Microsoft customers to capture employee perception and behavioral data holistically all in one place, without needing to add any additional vendors.
- The integration will provide users with a stronger set of capabilities that provide them with feedback, recommendations, and action items within the productivity tool they already work in, thus, enabling leaders to respond to needs in a timely manner.
What does it mean for Glint?
According to Microsoft, existing Glint customers will be able to continue to use the current Glint offering delivered by LinkedIn. New new customers can purchase the existing Glint service on a standalone basis through LinkedIn or bundled with Viva through Microsoft for now.
Glint will continue to benefit of combining passive data with their perception data and providing valuable insights to their customers around engagement, well-being, and burnout. Specifically, it will help Glint with:
- Access to rich passive continuous behavioral data that will deepen their insights on employees and managers. For example, we expect Glint should now be able to access metrics around learning sources and knowledge topics being accessed (through Topics and Learning modules). The possibilities of how those metrics can be used, such as to understand DEIB, performance management, learning and development, are huge.
- Having a greater impact on their customers. Once fully integrated, Microsoft HR customers should be able to access the deeper analytics side of the product provided by Glint, while managers and leaders should be able to receive recommendations and feedback in the apps they use. This should result in more action taking, wider action adoption, and greater impact in general among the customers.
What does it mean for Microsoft Viva?
Given than Glint was already integrating into Viva’s Insights module, a complete integration into the entire suite makes complete sense for Microsoft. Overall, it does a few things for Viva.
- Equips Microsoft with enhanced employee listening. By rolling their engagement survey into Glint, Microsoft will be able to leverage Glint’s impressive employee listening capabilities for its customers through its various surveys.
- It provides more value for potential customers. Viva just became a whole lot more appealing to existing and potential customers who might have been considering adding Glint to their people analytics ecosystem.
- Adds a more focused approach to supporting managers and employee development. Glint has long been building its capabilities to build a product that empowers managers to engage and develop their employees through feedback and recommendations. As part of Viva, these capabilities should make the solution more attractive to leaders.
What does it mean for the people analytics and employee experience tech market?
There are 2 big implications of this move for the tech market.
- At its inception, Microsoft Viva was essentially a modern take on the intranet, with the addition of analytics. With a complete integration of Glint and its focus on supporting managers and employees by providing them data-based insights and recommendations, Viva should be able to become a serious player in the people analytics space.
- The rise of employee engagement and experience vendors that are able to bring in rich passive data to supplement employee perception data. Perceptyx and Viva have built into their products an impressive suite of capabilities that are able to provide a more complete picture of not just what the employees are feeling, but when and why they are feeling it, and what they can do to improve or address any challenges as quickly as they arise.
The future
We will have to wait another year to see what the final integration looks like. It will be interesting to see if insights from Glint will be connected with those from Ally.io, an OKR (objectives and key results) tool, acquired by Microsoft in 2021 that is integrated into Viva, and how they will be delivered to the users, especially given that Glint has a performance management product as well.
Glint has always applied a thoughtful approach to its product and the organizational needs it should help address. Given that, it’s safe to say that Microsoft Viva will benefit significantly from making Glint a part of it. We look forward to seeing the final product.
Your Guide to DEIB Analytics
Posted on Tuesday, February 15th, 2022 at 6:20 PM
It’s 2022. Do you know where your diversity, equity, inclusion, and belonging (DEIB) data is?
Let’s take a step back; do you know which data you should be looking for? If yours is one of the 80% of orgs that still do not track or analyze data on discrepancies in performance, compensation, and hiring—or even if it belongs to the other 20%—this note is for you.
Track your DEIB metrics to know if you are making progress on your goals.
There is no better time than now to get started.
The pandemic has fundamentally shifted how people approach their professional lives and seek purpose at work. 52% of employees say the pandemic has made them question the purpose of their day-to-day job, and 65% are rethinking the place work should have in their life. Businesses are faced with challenges and need to provide employees with a sense that theyare valued, and their work has an overall impact on society. One of the best ways orgs can do this is by focusing on areas of DEIB, such as helping address existing issues of fairness and equity.
But wait, you might be thinking, where do I even start? There’s so much data out there; how do I know which metrics I should be looking at?
As part of our ongoing study on DEIB and analytics, we recently released a guide on DEIB Metrics that provides:
- A foundational understanding of the different metrics that can be used to measure and track DEIB performance, including exhaustive lists of metrics for each diversity, equity, inclusion, and belonging
- Insights on how those metrics might vary depending on your where your org is at in its DEIB and analytics journey
If you want to learn more about how orgs can lead with purpose and the role of DEIB in it, check out Stacia Garr’s upcoming HR Technology Conference keynote on March 3.
Perceptyx Acquires Cultivate, Enabling Ubiquitous Listening Capabilities
Posted on Tuesday, February 15th, 2022 at 1:49 PM
This morning, Perceptyx, an employee engagement and experience provider, announced it acquired Cultivate, an employee listening tech vendor. This acquisition is representative of a broader shift we’ve been talking about within the employee engagement and experience market. As such, we’ll cover what is happening in this space and then dive into the specifics of this acquisition.
Evolutions in the Employee Engagement & Experience Market
As we mentioned in our 2021 study, People Analytics Tech: Deep Dive into Employee Engagement & Experience, vendors in the employee engagement and experience space offer capabilities that enable customers to do four things:

Figure 1: Role Played by PAT in Employee Engagement & Experience | Source: RedThread Research, 2021/2022.
The first item, “Collect and analyze perception data directly from employees,” and the last item, “Highlight areas of concern and recommend actions to users,” is where employee engagement and experience vendors have typically focused. We’ve seen these vendors increasingly dip into the other two items over the last few years.
In addition to this evolution, the employee engagement and experience market has been converging with others. As we wrote in our summary of Peakon’s 6-month integration into Workday, the following areas have been coming together for years:
- Employee engagement/experience
- Performance management
- Recognition
- People data integration
When you look at the intersection points of all these areas and vendors, you get a chart that looks something like Figure 2 (note, we are in the process of conducting our 2022 People Analytics Tech study, so the vendors’ names will be updated shortly).
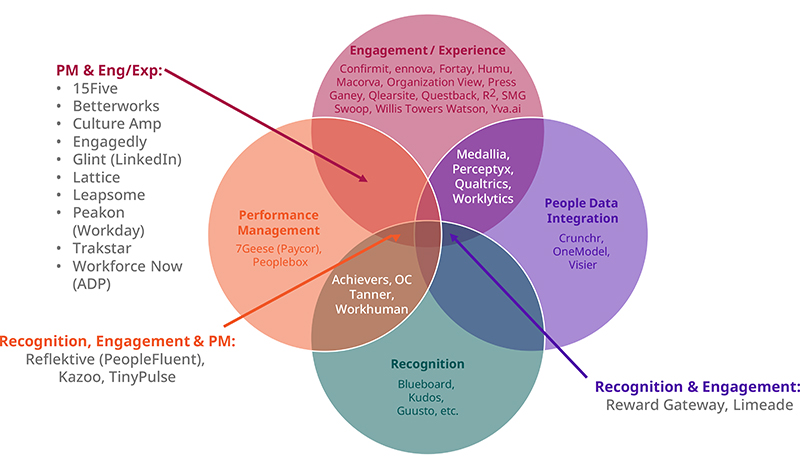
Figure 2: Vendors in the Engagement / Experience, Performance Management, Recognition, and People Data Integration Spaces | RedThread Research, 2021.
As we said before, we are seeing so much overlap because vendors and customers realize that it is no longer realistic to separate these concepts. How do you understand engagement without also understanding performance feedback? And how do you give performance feedback without also giving recognition? And how do you understand any of this without solid people analytics?
Given this backdrop, let’s turn to this acquisition.
Who is Cultivate?
Cultivate is an AI-powered coaching platform that absorbs data from other systems – such as email – and provides feedback to managers about how they are communicating with their team members. It uses a combination of data and insights to make managers aware of behaviors and suggest ways to change them. For example, a manager may get a prompt telling her that she is sending less than 5% of emails to her team after work hours—which is good—but that prompt may also identify the individuals to whom she is sending after-hours emails. In our 2021 study, Coaching Tech Landscape: Humans and Robots, we call Cultivate a “coach on the shoulder.”
Some of the things we like most Cultivate include (check them out in our PAT tool):
- The use of AI to make specific individualized suggestions on how to improve digital behaviors and relationships
- Personalized nudges delivered before specific events, such as 1:1s, via email or chat, instead of requiring managers to access dashboards
- Partnered with Harvard Business Publishing (HBP) and mapped HBP’s library of leadership content to Cultivate signals, to pair suggestions and opportunities with HBR’s bite-size learning content on how to take action
Why did Perceptyx buy Cultivate?
It may not be immediately apparent why an employee engagement and experience vendor bought a vendor that’s a “coach on the shoulder,” but there are two really smart reasons for this buy:
- The underlying technology
- Building out and augmenting Perceptyx’s overall product offering
Cultivate has some of the most sophisticated NLP and AI capabilities on the market to understand employee tone, sentiment, and behaviors. This capability can be integrated throughout Perceptyx’s offering. This will widen and strengthen Perceptyx’s ability to deliver insights on qualitative data.
Further, this underlying technology will allow Perceptyx to better offer the other two items in Figure 1:
- Collect and analyze passive data on interactions/work/environment
- Integrate and analyze different data that drive employee engagement and experience
Specifically, Cultivate will enable Perceptyx to move from offering point-in-time perception data to truly “ubiquitous” listening by ingesting passive data on employees’ interactions, looking for patterns, and providing employees with feedback. Incorporating these data into Perceptyx’s overall data analytic capabilities will make the solution more robust. It can start to give the why around employee engagement and experience, not just the what.
Finally, this acquisition – along with the July 2021 acquisitions of Waggl and CultureIQ – enables Perceptyx to better build out its comprehensive employee engagement and experience offering.
As shown in Figure 3, they now offer:
- Ask: Employee surveys (the historical Perceptyx survey product)
- Sense: Lifecycle surveys (again, historical Perceptyx) and always-on listening (Cultivate)
- Dialogue: Crowdsourced idea-generation and voting (Waggl)
- Develop: Multi-rater feedback (historical Perceptyx) and recommendations (Cultivate via HBR mapping)
All of this is anchored by the Perceptyx People Insights Platform, which provides a single location to understand and understand all these different insight “channels.” It also provides a way to prioritize the following steps and act.
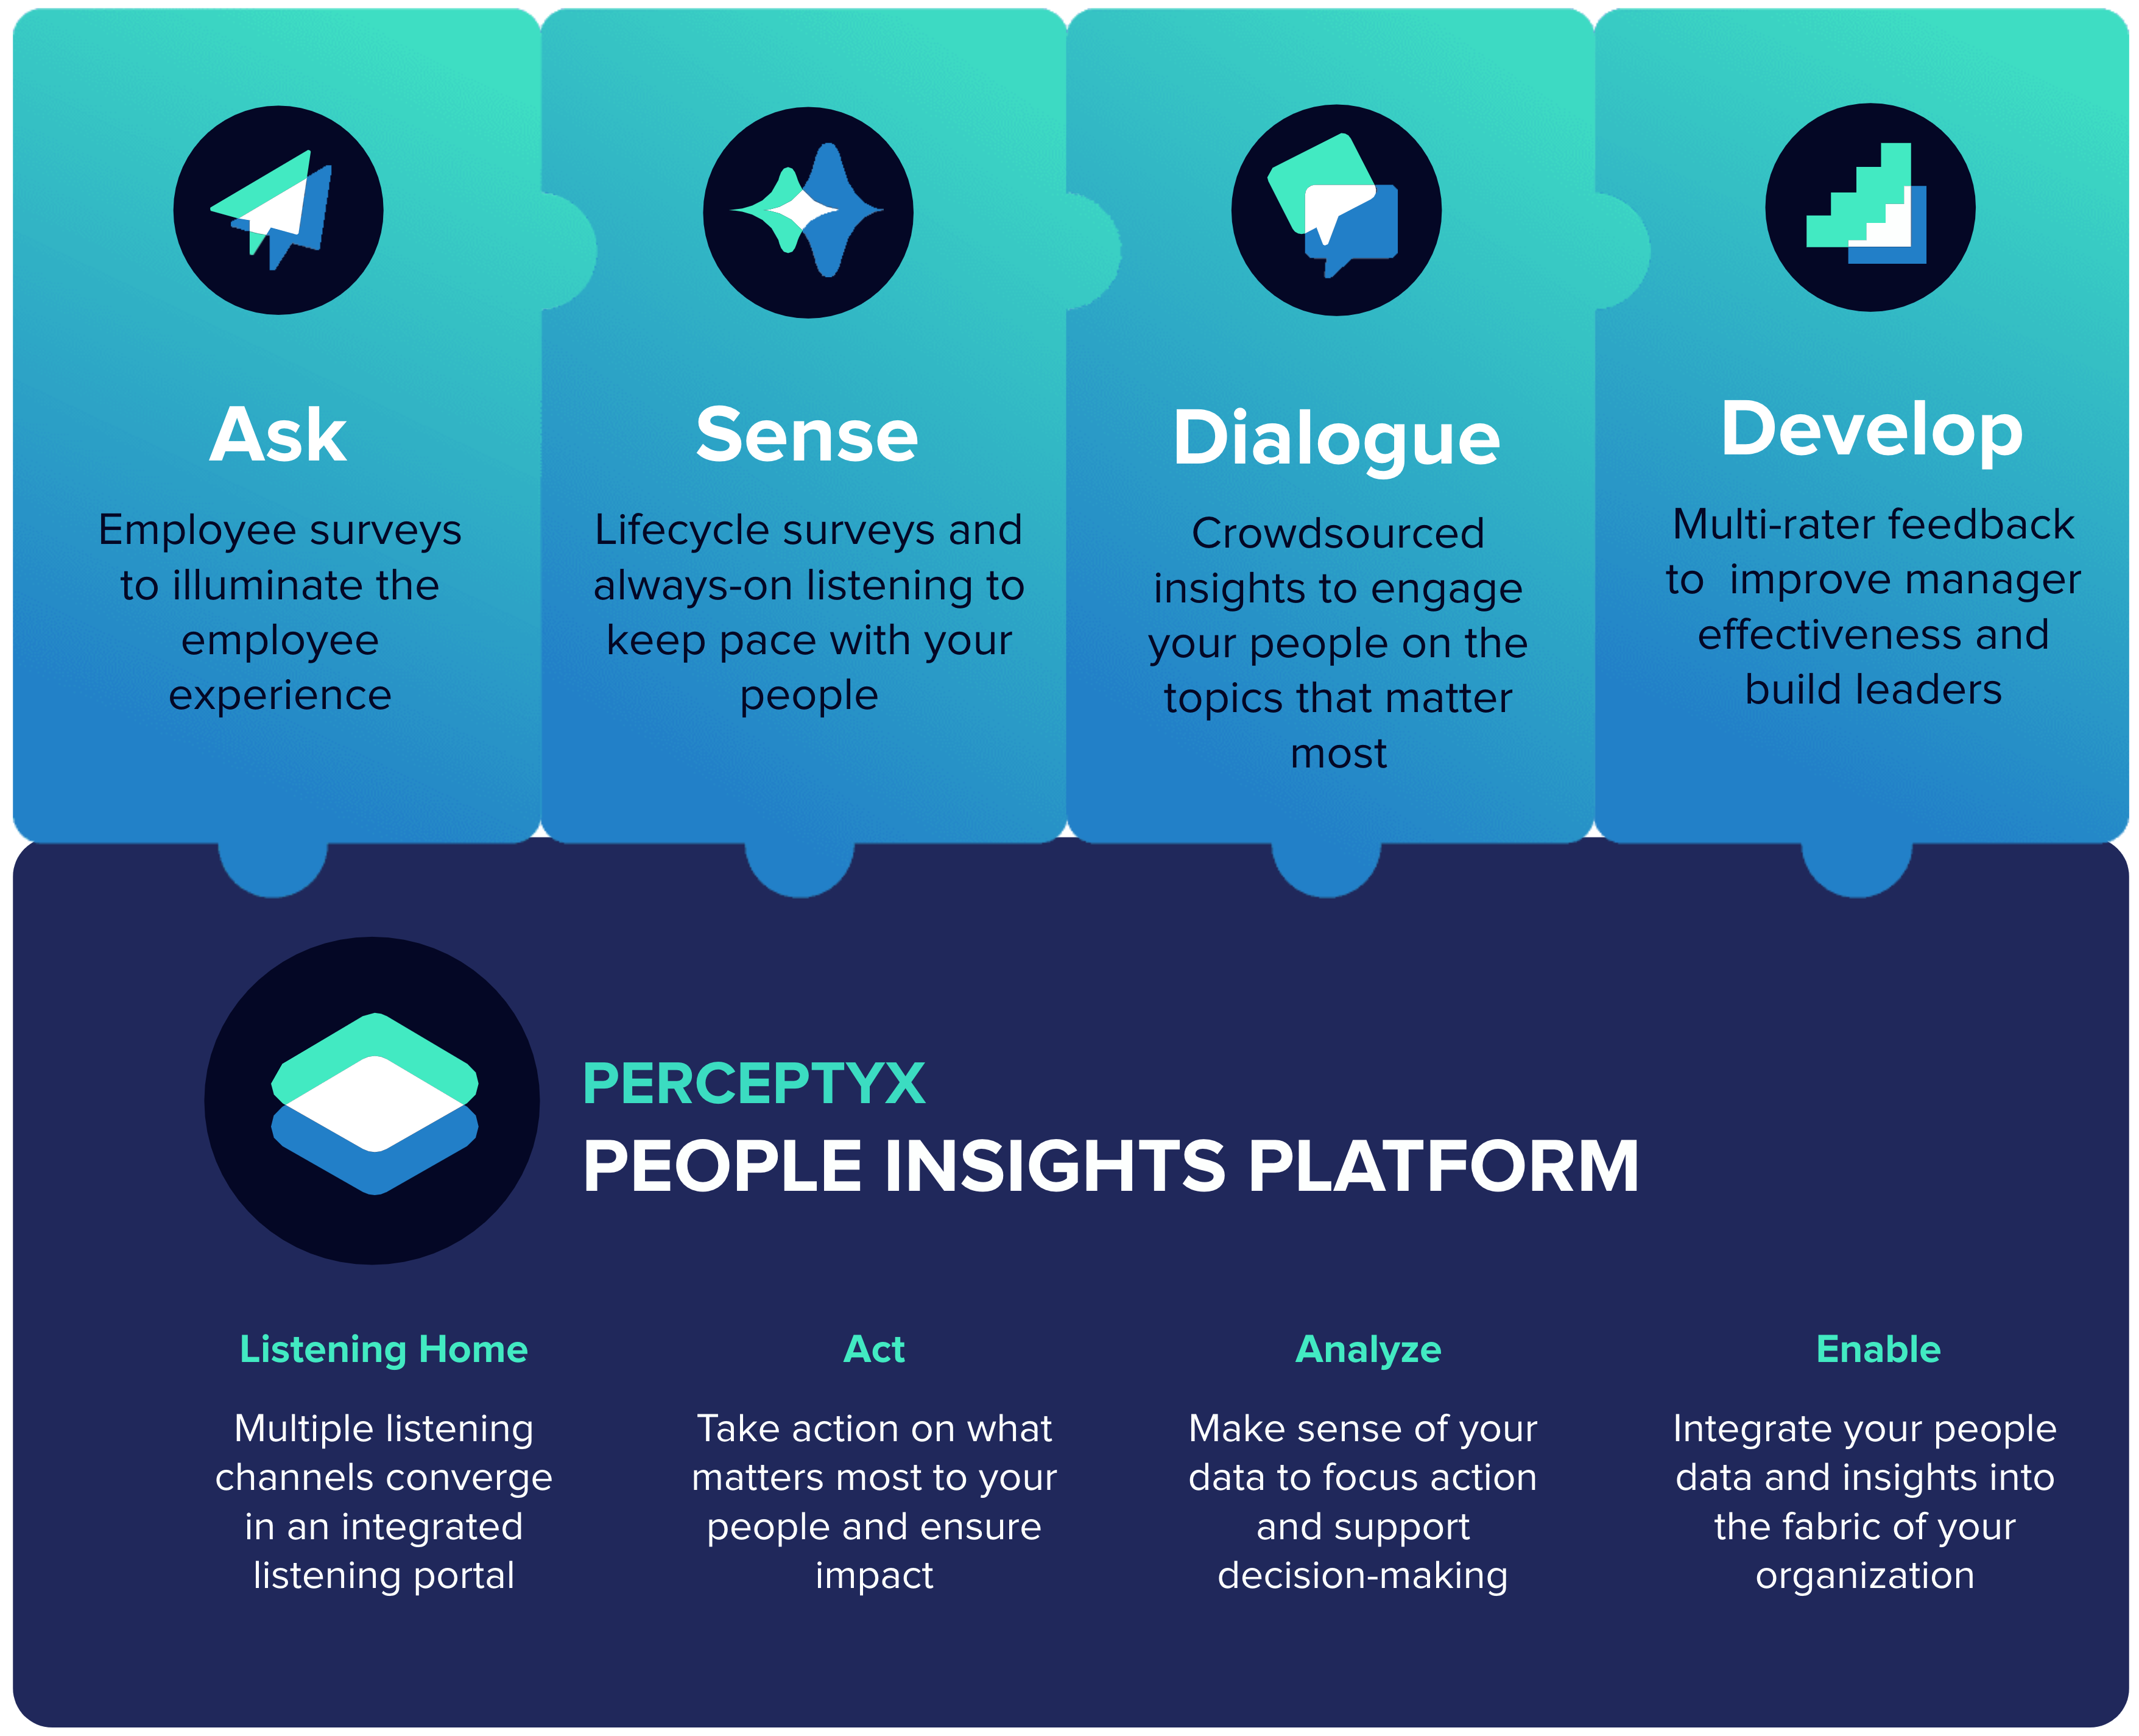
Figure 3: Perceptyx’s Product Offering | Perceptyx, 2022.
Comments/Concerns/Questions
We are fortunate to know both companies very well and are very positive about this acquisition. We have long thought a lot of Joe Freed, CEO of Cultivate, his team, and the technology they’ve built, and are pleased to see them align with Perceptyx, another company we respect immensely. This acquisition will round out Perceptyx’s offerings while enabling the Cultivate team to maximize their impact in the market significantly. We think this is a very sound decision for all and will provide some significant benefits to customers.
That said, I would likely as soon stop breathing as stop having concerns and questions. Given that, here’s what we are going to be watching:
- Ethics and monitoring: We all know there’s a fear out there of extensive monitoring by companies – especially with so many people working from home – and lots of people are searching for monitoring tools.
(Just Google “big brother monitoring” and see what the autofill provides. Don’t worry; I will wait here – go do it. Oh, you also found “big brother monitoring tool free download”? So surprising!)
Now, Cultivate has historically avoided this issue by making their tool opt-in – so employees have the choice of whether they leverage the software – and ensuring that only employees get individualized data and recommendations. Companies and managers only get high-level summaries of what is happening. So far, this seems to be working – our understanding is that, to date, Cultivate has seen less than 5% of folks either opt not to participate or opt-out once they have participated.
Perceptyx will have to continue to hold that line on opt-in and privacy with this acquisition, and they have indicated to us that they plan to do so. Further, there will be questions about how passive data should be combined with engagement data. The ethics and privacy considerations around these questions are not necessarily defined, let alone answered. This will be something for Perceptyx to work through in tight concert with their customers in the coming months.
- Acquisitions everywhere: Perceptyx has acquired three companies in nine months, which is a rapid clip for any company, let alone one that has fewer than 500 employees. Perceptyx is aware of the challenges this can create and is rapidly integrating its acquisitions and reconfiguring teams. Hence, there aren’t historical Perceptyx and new acquisition teams, just new teams. Even so, the frequent evolution of teams, additions of new people, combinations of cultures, etc., will be challenging, and making everyone work together well will be a constant effort for months to come.
- Slowing evolution to PM and recognition offerings: As mentioned in Figure 2, we see vendors increasingly adding performance, recognition, and learning to their engagement offerings as customers look for less fragmented solutions and easier data integration across core talent management activities. We understand that Perceptyx was also headed down this path before these acquisitions and that these events will slow down their addition of these offerings. On the one hand, this will allow Perceptyx to focus more specifically on employee engagement and experience – on the other hand; it may prevent them from keeping up with some of their competitors. We will watch how these acquisitions impact their customer growth rates and satisfaction.
Despite these concerns and questions, the bottom line on this acquisition is that it is a good thing. Congratulations to the Cultivate and Perceptyx teams on an exciting new future ahead of them!
Can L&D functions lead us into the future?
Posted on Wednesday, February 9th, 2022 at 6:22 PM
So, what many HR professionals have been fearing is maybe starting to come to pass: ByteDance, who owns the better-known TikTok, recently dissolved their Talent Development function. The entire department was let go over the holiday break in a virtual meeting.
While I find many things interesting about this move (the way they did it, the timing, etc.), the 2 things I find most interesting are their reasoning and solution.
Their reasoning
ByteDance felt that "many learning events, such as online talks of mediocre quality…that could easily be found on the internet didn't make good use of their employees' time."
An internal memo also mentioned that while employees believed these opportunities were "personally helpful," they were more of a feel-good initiative with limited and questionable value.
In short, L&D wasn't making the cut.
Their solution
ByteDance claims that developing talent is still a big priority—they just think they can do it better without a dedicated L&D function. Instead, they have looked at employee needs and distributed employee development responsibilities throughout the organization. In essence, development has become everyone's responsibility—not a particular department's.
While this move may seem extreme (and scary), I don't think this is the last time we'll see it. In fact, we are seeing hints of it in our current research about the learning methods employees use for learning: employees don't rely on courses nearly as much as L&D functions would like to believe they do, and many of the other methods they do use for development are happening on the job, as a part of the work, by other departments, and on their own—not through L&D.
Add to that the very loud discussion many orgs are having about skills, and I'm reasonably sure that the future of talent development will look wildly different from the past. Or even the present. I'm certainly not advocating jettisoning the L&D function, but I am a realist—L&D functions have to be able to lead the charge forward. If they can't, someone else will, and we'll have to follow.
DEIB Metrics: An Essential Guide
Posted on Wednesday, February 9th, 2022 at 2:44 PM
Download This Report[/button]
Introduction
At this point, the business case for diversity, equity, inclusion, and belonging (DEIB) is clear. Our own research (see Figure 1) shows the relationship between having a strong DEIB culture, and critical individual and performance outcomes.1
Yet, for years, the representation of diverse populations in organizations improved almost imperceptibly.
Then we had a global pandemic and the rise of a social justice movement, sparked by the murder of George Floyd. Along with that came the heightened awareness that the pandemic was impacting diverse populations much more—particularly for women and people of color who were dropping out of the workforce at higher rates than other populations. As a result of this confluence of events, organizations began making big promises on DEIB in the summer of 2020.
When this happened, one of our first questions was how organizations would show that they’d made good—or at least made progress—on those commitments. While DEIB metrics measurements designed to understand DEIB—are the obvious answer, how to select, collect, use, and maintain those metrics is not so clear.
Thus, this research initiative on DEIB metrics and analytics was born. The first article in this series, “DEIB Analytics: A Guide to Why & How to Get Started,” provides leaders with a plan on how to begin using DEIB metrics and analytics. We’ve shared an 8-step guide with details on the actions and considerations that organizations need to take to effectively implement DEIB metrics.

Figure 1: The impact of a strong DEIB culture on individual & organizational outcomes | Source: RedThread Research, 2022.
This article: An essential guide to DEIB metrics
This report focuses more narrowly on the appropriate metrics and analytics for DEIB. We aim to provide DEIB leaders, people analytics practitioners, HR business partners, workforce planning and talent management leaders with:
- A foundational understanding of the different metrics that can be used to measure and track their DEIB performance
- Insights on how those different metrics might vary, depending on their org’s sophistication with DEIB and analytics
This article is based on a wide range of information, including our research on:
- People analytics technology2
- DEIB analytics3
- DEIB strategies4
- DEIB technology5
- A literature review of DEIB and analytics6
- Interviews with ~20 people analytics and DEIB practitioners
Our research focuses specifically on the people within an organization’s existing workforce. We know a number of other DEIB metrics exist that orgs should also consider, such as those which apply to their supply chain, community efforts, ESG (environmental, social, and governmental) requirements, etc. While critical, those areas are outside the scope of this report.
We would also like to mention that this report is the first of its kind, in that it attempts to provide a holistic look at all talent-related DEIB metrics. Any first try will miss some critical elements and we acknowledge this report may be incomplete. We invite you to share any suggestions, feedback, or additions you think appropriate by emailing us at [email protected].
The DEIB space is evolving quickly, and we will only make progress by putting out our best ideas and amending them quickly as new information becomes available. Thank you for being part of that process and pushing forward toward greater opportunities for all.
Defining DEIB
Let’s start our essential guide by defining our terms (see Figure 2).

Figure 2: Definitions of diversity, equity, inclusion & belonging (DEIB) | Source: RedThread Research, 2022.
Why are DEIB metrics & analytics important?
Some of the common reasons why leaders start to focus on DEIB metrics and analytics include:
- Creating a clear business case for DEIB
- Measuring the return on investment (ROI) of DEIB expenditures
- Tracking the impact of critical DEIB initiatives
In addition to these, a few more reasons why orgs should use DEIB metrics and analytics include:
- Busting myths or addressing anecdotes that may or may not be true
- Checking assumptions about DEIB
- Meeting consumer, investor, and employee expectations when it comes to progress on DEIB
While these are all good reasons to use DEIB data, one of the most compelling motivations for why DEIB is critical was articulated by one of our interviewees:
“Companies have been setting diversity goals for decades but have struggled with “goal-getting”—meaning the clear accomplishment of those goals—because of a lack of feedback and data to help them get after those goals every day. Without any feedback on progress, companies lose sight of the goals.”
—Phil Willburn, Head of People Analytics & Insights, Workday7
Why do orgs find DEIB data difficult to use?
Many leaders struggle to use DEIB data for reasons such as the following (see Figure 3):
- Challenges in identifying and using appropriate metrics. Historically, very few orgs have attempted to track metrics for DEIB and even fewer have ventured beyond collecting diversity data. Often, leaders are unsure which metrics can and should be measured for DEIB. Even if they’re able to identify them, leaders then often face challenges around tracking and integrating the data.
- Legal, security, and privacy issues. DEIB data involves sensitive information—and this comes with legal and security challenges around data collection, storage, and usage. As a result, some orgs hesitate to collect and use it. Additionally, employees may be hesitant to provide it, due to data privacy and access concerns.
- Poor alignment with goals. Orgs find it challenging to use the data if there’s no or poor alignment between the data collected and the overall DEIB goals that the company wants to achieve. As result, there can be a sense of helplessness, which can render the data not as helpful.
- Data responsibility issues. Because DEIB data can reside in multiple systems under several functions (e.g., HR, D&I, IT, sales), there can be a lack of clarity around who is primarily responsible for the data and how / when it can be shared.
- Data interoperability issues. Related to the previous point, orgs often find it challenging to use data collected in one system on another due to integration issues and capabilities of the tech solutions in place.

Figure 3: Challenges to using DEIB data by orgs | Source: RedThread Research, 2022.
For this article, we focus on the first bullet to help orgs identify the range of metrics they can use.
“When you have members of a minority group who are leaving at a higher rate, that’s telling you something is wrong, and it helps steer you to where the problems are. It needs to be measured at quite a low level in the company because that’s the way you find where your hot spots are.”
—Fiona Vines, Head of Inclusion and Diversity and Workforce Transition, BHP8
Clarifying diversity metrics
As we highlight in our report “DEIB Analytics: Getting Started,” the essential first step to creating diversity metrics is collecting appropriate demographic data. Essentially, the data collected should allow orgs to answer 3 questions:
- What does our current workforce look like across different levels (hierarchy) and functions / business units?
- Who are we hiring (internally and externally) across different levels?
- Who is leaving the org and at which level(s)?
It’s important that leaders not only look at simplistic diversity numbers, such as gender or race / ethnicity—they also need to consider multilevel diversity, known as intersectionality, such as Black women or gay Asian men. This additional analysis helps leaders understand their workforce at a more nuanced level, and make better recommendations and changes.
Many orgs track basic diversity numbers: 96% of U.S. companies report the gender representation of their employees at all levels and 90% report gender representation at senior levels.9 However, far fewer orgs look at intersectionality: Only 54% of companies track gender and race / ethnicity—such as Black or Latina women in senior leadership.10
Figure 4 is a list of common demographic data that we’ve seen orgs collect (for a more comprehensive list of data that could be collected, please see our definition in the earlier section). It’s important to note the significant legal limitations in different countries as to which of the following can be collected and stored. Your org’s legal counsel should always be involved in determining which data to collect.

Figure 4: Commonly collected diversity demographic data | Source: RedThread Research, 2022.
While comparatively easy to collect and analyze, orgs should be wary of trying to do everything at once when it comes to diversity metrics. Leaders should first figure out the immediate challenges or business issues they want to solve for and identify the appropriate metrics accordingly.
Examples of diversity metrics
Figure 5 offers a list of the metrics that orgs can use to measure diversity. Many orgs already collect most of these metrics through their human resource information system (HRIS) or applicant tracking systems (ATS). By adding a demographic lens to these metrics, orgs can quickly understand the state of diversity within the org.
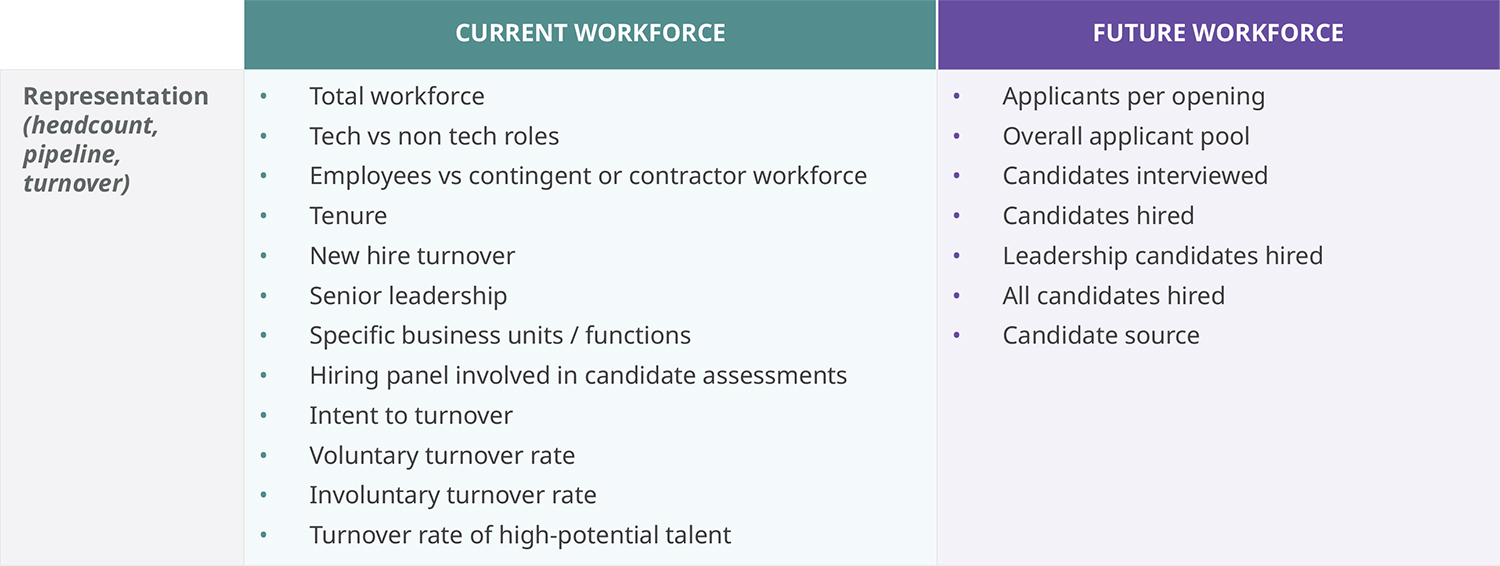
Figure 5: Metrics to measure diversity | All items should be measured by number and demographic distribution, unless otherwise stated. | Source: RedThread Research, 2022.
Real-World Threads
Using diversity data to improve hiring11
As part of its diversity goals, an industrial manufacturer wants to achieve 50% female parity in leadership roles by 2030, and create a globally diverse workforce with inclusive leaders and teams. In order to do so, the company needed an accurate picture of their current workforce diversity mix and the recruiting pipeline.
Working with a technology provider, the company looked at its recruiting pipeline to better understand how women and minorities move through the full process from recruiter review to meetings with the hiring manager. A review of the talent acquisition process revealed that the number of women applicants was disproportionately lower than their male counterparts. Additionally, as women moved through the hiring process, they were more likely to be dropped during the interview process.
To tackle these challenges, the company implemented:
- Programs for hiring managers, including unconscious bias training
- Workshops on inclusive conversations to enable a better hiring experience for women and minority candidates moving through the process
As a result of these actions, the company is in a better position to meet its 2030 goals. It’s also working to attract more women and minority job applicants through strategic partnerships with the Society of Women Engineers and the National Society of Black Engineers, among others.
Understanding equity metrics
Equity metrics can help orgs understand the effectiveness of their processes, and identify unfair or biased systems, practices, and policies. Research conducted in 2021 revealed that when employees are treated fairly, they’re:12
- 8 times more likely to look forward to going to work
- 3 times more likely to have pride in their work
- 4 times more likely to want to stay a long time at their company
Equity metrics can be measured from data collected via several sources, such as:
- Learning and development data
- Performance management data
- Payroll
- Employee engagement / experience data
Ensuring fairness in the distribution of resources, opportunities, and access can help leaders address existing systemic inequities within the orgs. The point to note here is that the distribution needs to be fair, not equal. The difference between these two concepts is shown in Figure 6.
Thus, the goals of measuring and tracking these metrics should not be to ensure equality or sameness for everyone, but rather to:
- Detect areas in which systemic inequities exist
- Identify differences in capabilities, resources, and needs
- Implement systems and process that take these into account
While orgs have a strong case for creating a fair and equitable environment, many struggle to do so. For example, our 2021 study on performance management trends revealed that only 48% of employees believe their performance evaluation process is fair and consistent.13 As orgs continue to manage unique needs and challenges for different employees, leaders will increasingly need to address issues around managing fairness and equity across varied employee experiences.

Figure 6: Visualizing equity
Source: Robert Wood Johnson Foundation, 201714
Examples of equity metrics
Below is a list of metrics that orgs can use to understand, measure, and track equity. All metrics should be analyzed by the different demographics collected by the org to understand the differences in opportunities, access, and renumeration for various groups.
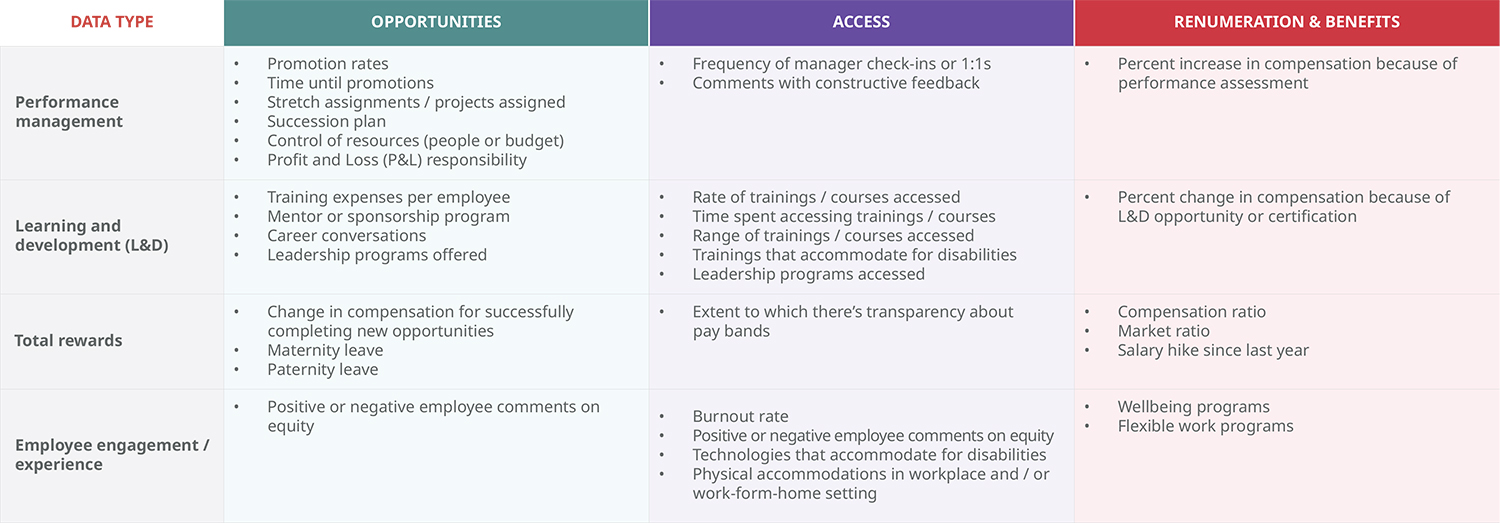
Figure 7: Metrics to measure equity | All items should be measured by number and demographic distribution, unless otherwise stated. | Source: RedThread Research, 2022.
Real-World Threads
Using people analytics to create a more equitable environment
- Uber.15 Shortly after the start of the COVID-19 pandemic, Uber’s People Analytics team found that employees with children younger than 5 years of age scored lower than the company average on engagement and satisfaction metrics. To help provide them with the support they needed, the company added some flexibility options to help those employees balance childcare with work.
- A midsized U.S. law firm.16 Upon auditing its performance evaluations, the company found that only 9.5% of people of color at the firm received mentions of leadership in their performance evaluations—more than 70 percentage points lower than white women. The company changed the evaluation form that broke down job categories into competencies and asked that ratings be supported by at least 3 pieces of evidence. They also developed a 1-hour workshop to teach everyone how to use the new form.
As a result of these changes:
- Comments with constructive feedback for people of color increased from 17% the year before to 49%
- Women also received greater constructive feedback (from 10.5% the previous year to 29.5%)
Identifying inclusion metrics
After diversity, inclusion is the most common area that organizations tend to measure. According to a 2018 study, a little more than 50% of orgs measured inclusion.17 While the focus and urgency around this area has increased over the years, few orgs are doing anything beyond tick-the-box exercises.18
“Let's say that the engagement score for our company is high at 80%, and that makes us happy. And then you realize that 80% of your employees are White—which means that you’re not really hearing the voice of those under-represented groups. Inclusion analytics is about pulling that out, and making sure you have a good sense of where everybody's falling on all of your core metrics.”
—Hallie Bregman, PhD, Global Talent Strategy and Analytics Leader19
There are a few reasons why orgs should focus on understanding and measuring inclusion. Orgs with an inclusive culture:20
- Are twice as likely to indicate they met business goals from last 3 years
- Are 81% more likely to indicate high customer satisfaction
- Have employees that are 45% more likely to stay
- Have employees that are 2 times more likely to give a positive Net Promoter Score® (NPS)
If these reasons weren’t enough, the volatility of 2020 and 2021 has resulted in many companies facing tough questions around their efforts in this area. According to a recent analysis of S&P 500 earnings calls, the frequency with which CEOs talk about issues of equity, fairness, and inclusion on these calls has increased by 658% since 2018.21
Inclusion metrics can help orgs understand whether employees feel:
- Accepted by others in the workplace
- Integrated into and a part of the wider organization
- Respected for their work by others
As alluded to above, orgs can typically approach inclusion metrics in 2 ways—employee perception data and object data. We explain the differences between the 2 in Figure 8.

Figure 8: Employee perception & objective data for inclusion | Source: RedThread Research, 2022.
Examples of inclusion metrics
Figure 9 offers a list of metrics that orgs can use to understand, measure, and track inclusion. These include metrics that directly impact an employee’s sense of inclusion (e.g., mentor relationships and strength of connections with others), as well as some not-so-obvious metrics that can drive inclusion (such as the average distance between office and home, which can adversely affect employee experience).

Figure 9: Metrics to measure inclusion | All items should be measured by number and demographic distribution, unless otherwise stated. | Source: RedThread Research, 2022.
Real World Threads
Understanding and embedding inclusion within everyday behaviors
When it comes to inclusion analytics, an international electronics company believes in embedding inclusion in everyday behaviors, activities, and processes across the company. It’s been collecting data and doing the research for more than 5 years to understand the key behaviors that impact inclusion at the organization. Because of its groundwork, the company was able to identify 4 metric areas that they needed to track and analyze on a regular basis:
- Net Promoter Score
- Job fit
- Employee engagement score
- Intention to turnover
The people analytics team approaches these metrics in 2 ways, by:
- Checking in with new hires and collecting the data from them
- Making sure that all employee surveys administered by the org contain questions that tie into these metrics
By collecting this information regularly, the company has been able to identify pain points and concerns experienced by diverse populations, especially in the current times—and plan initiatives and appropriate decisions around topics, such as vaccinations, return to offices, rollouts of wellbeing programs, and measurement of the financial impact of those programs.
Specifically, the company has extended its remote working policy because they determined that return to office will disproportionately impact their female workforce and potentially increase their turnover by 33%. It also rolled out a $300 COVID Wellbeing credit that can be used towards children’s tutoring costs, wellbeing app subscriptions, tax preparation costs, etc. to help employees—especially parents and caregivers who are more impacted by the pandemic. Additionally, the company re-examined and adjusted its communication and approach on vaccine education as result of employee feedback.
In addition to these measures, the people analytics team has also been able to use insights from inclusion analytics to identify areas in which different groups need support. For example, the company found that its millennial workforce needed and wanted greater support for financial planning as part of its benefits program. The company added specific financial wellbeing offering in its annual benefits open enrollment to support Millennials and Gen Z.
In another example, the company was able to build more inclusive policies around statutory and floating holidays that take into account the fact that employees with different religious backgrounds might want to take different holidays.
As a result of these efforts:
- Net Promoter Score of the company increased by 7%
- Confidence in Leadership increased by 8%
- Employee Engagement increased by 5%
Defining belonging metrics
While closely related to inclusion conceptually, it’s important that orgs pay equal attention to measuring and understanding belonging. We explain how belonging is different from inclusion in Figure 10. A high sense of belonging among employees can result in:
- An increase in employee happiness and employee engagement, which in turn impacts employee retention22
- A significant increase in job performance23
- A reduced turnover risk and a decrease in employee sick days24
Analytics based on belonging metrics can serve as a leading indicator of critical diversity outcomes as well. Specifically, belonging metrics can help orgs to:
- Gain a deeper understanding of the sense of security experienced by employees
- Find out if employees feel connected with the org’s values and purpose
- Bolster their ongoing efforts around inclusion and equity
“When someone is experiencing a sense of Belonging, they feel freer, they feel more creative and their opportunity to potentially have an impact at work is significantly increased.”
—Kate Shaw, Director of Learning, Airbnb25

Figure 10: Belonging versus inclusion | Source: RedThread Research, 2022.
Examples of belonging metrics
Figure 11 offers a list of metrics that orgs can use to understand, measure, and track belonging. While some metrics speak to belonging directly (e.g., a belonging index as part of an engagement survey), others should be used in combination with one or more additional metrics to gain a better understanding. For example, by looking at metrics around the number of resources groups offer and the participation rates for them, orgs can try to understand if employees feel supported. Employee feedback comments specific to these topics can provide even more context of the underlying issues.

Figure 11: Metrics to measure belonging | All items should be measured by number and demographic distribution, unless otherwise stated. | Source: RedThread Research, 2022.
Real World Threads
Using nontraditional metrics to add depth to understanding26
A number of companies look beyond the obvious metrics and data to gain a deeper understanding of the current state of DEIB within their orgs. For example:
- Cindy Owyoung, the Vice President of Inclusion, Culture, and Change at Charles Schwab, looks at the metrics around growth and vitality of the company’s employee resource groups (ERGs). By tracking metrics such as the number of ERGs and the number of participants in them, the company is able to really understand the work Schwab’s ERGs are doing and whether they are providing value to their members.
In addition, these metrics can also be indicative of whether employees have the support they need to be able to participate in the ERGs and do the work that needs to be done.
- Zoom Video Communications is another company that lays emphasis on such metrics. According to Damien Hooper-Campbell, the company’s Chief Diversity Officer, these nontraditional metrics “serve as bellwethers.” The company looks at metrics around the ERGs and keeps a track of the number of allies who are active in ERGs.
According to Hooper-Campbell, “If you have a women’s employee resource group, do you have any men who are part of it? How many non-Latinx folks are part of your Latinx employee resource group and are contributing to it, or coming and listening to it?”
Such metrics can offer a more nuanced understanding of the extent of support experienced by different groups across the org.
DEIB metrics: Strengths & limitations
DEIB metrics are most effective when multiple types of metrics are combined to gain a clearer picture of DEIB holistically. (See Figure 12.) For example, by combining inclusion metrics with equity metrics, orgs can understand not only that different groups may be feeling less included, but also the specific reasons (e.g., unequal development opportunities or biased performance reviews) for it.
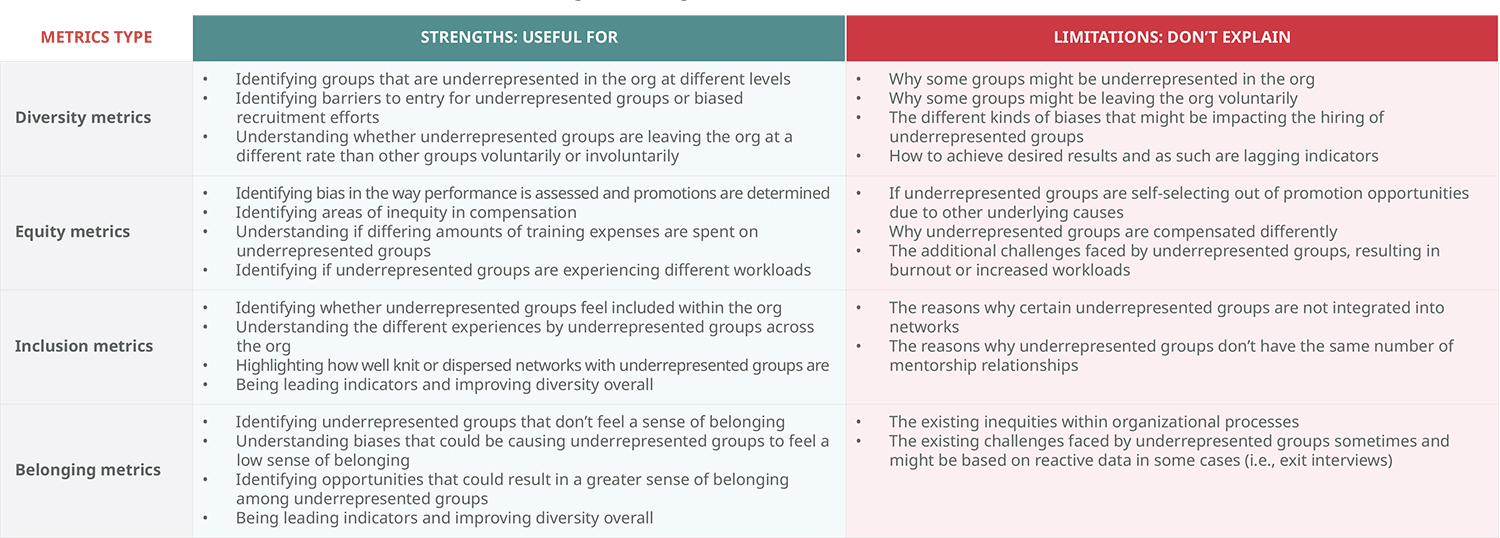
Figure 12: Strengths & limitations of DEIB metrics | Source: RedThread Research, 2022.
Using data sources for DEIB
Now that we’ve covered the specific metrics, let’s look at the data sources orgs can use for them. Orgs should keep a few things in mind when using such data:
- All data should be looked at with a demographic lens. For example, the number of trainings accessed by the workforce would mean little unless analyzed to see if white women access training more often than Black women.
- Data are more powerful when combined with other data. For example, data from the HRIS that shows exit rates should be combined with data from exit interviews, surveys, and employee comments on external review websites.
- Connectivity between data sources is essential to being able to use the data effectively. Data interoperability, or the ability for different data between systems to work together, is a necessity in order for orgs to drive DEIB. As such, they should look for tech and tools that enable them to do that.
- The partnership between DEIB and people analytics functions is critical. As we mention in our report “DEIB Analytics: Getting Started,” DEIB and PA leaders often come from different backgrounds and parts of the org, which mean partnership challenges may exist that must be addressed. The insights and expertise of both groups are necessary to use and interpret DEIB metrics effectively.
Common data sources for DEIB
Figure 13 shows that most of the data sources can be used for more than one DEIB area.
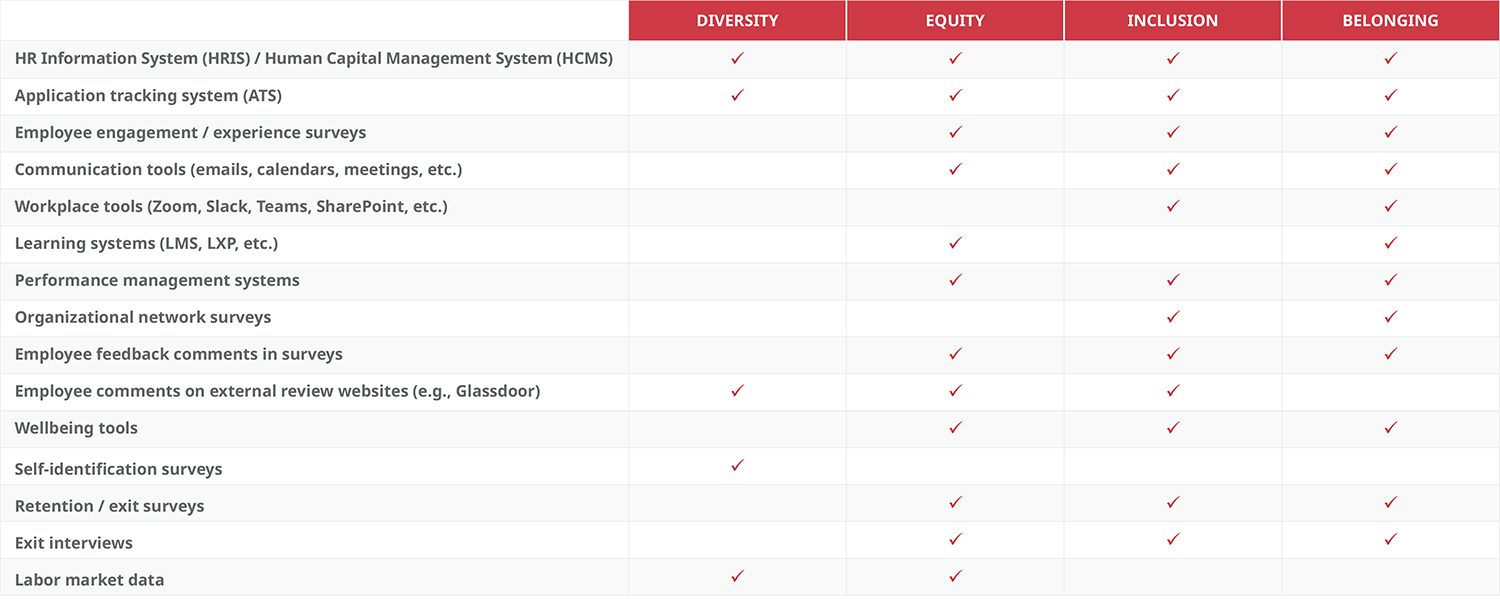
Figure 13: Data sources for DEIB metrics | Source: RedThread Research, 2022.
Beginning the DEIB metrics journey
Orgs at the beginning of their DEIB journey should try to answer the question: What’s the current state of DEIB within the org? As such they should focus on 2 things:
- Understanding the state of diversity
- Identifying “low-hanging” challenges—areas that need attention and are easy to quickly start working on
When it comes to selecting metrics, orgs should start with the basics, like:
- Getting their basic demographic data in order
- Measuring metrics around headcount, retention, and turnover to understand diversity
- Leveraging employee perception data—such as engagement surveys, feedback, and focus groups—to understand how different groups perceive DEIB at the org
Orgs should ensure that the selected metrics are clearly tied to overall strategy and that processes exist to track their progress.
A people analytics leader we spoke to mentioned creating a Python script to pull different metrics that they’re already collecting around talent acquisition, internal mobility, performance, engagement, and exit rate to understand where the biggest gaps are between different employee groups. This allowed them to quickly identify areas with the biggest gaps, start working on them, and track progress over time.
“The DIB world is so enormous, and you could do a thousand things. It's hard to understand where to start and where to focus your efforts. We should be intentional about identifying our biggest gaps. Every company has some problems around DEIB, but we should work on finding where our biggest internal gap is and focusing on that first.”
—Head of People Analytics, a large technology company

Figure 14: Questions to ask yourself | Source: RedThread Research, 2022.
Moving up to an intermediate level with DEIB metrics
Once the orgs have a clear sense of where they stand or the “what,” they need to understand the “why,” such as:
- Why do certain groups experience a low level of inclusion and belonging?
- Why are certain groups being promoted at lower rates than others?
Orgs can begin to supplement existing data to gain a deeper understanding of the systemic issues that impact DEIB. When it comes to metrics, orgs should look at data from existing systems:
- Learning & development data
- Performance management data
- Payroll data
- Wellbeing data
- Data from employee feedback comments
A technology provider shared an example of a customer project that conducted text analysis on data from employee feedback to understand why promotion rates for women were low in a company. The analysis revealed that the existing initiatives to drive promotions favored men and received positive feedback from them, as compared with women. Some of the concerns that surfaced included difficulties faced by women around childcare and the inflexibility around work schedules. The analysis of the data allowed the company to identify the systemic issues that were negatively impacting promotion rates for women and their overall DEIB efforts.
“Metrics are a way to communicate what’s important. Orgs should limit themselves to how many metrics they push. It’s like the weather, I don’t want a million different metrics to know if the weather is good of not. Orgs should figure out the goal (what is ‘good’ weather) and the metrics should help achieve that.”
—Dirk Jonker, Chief Executive Officer, Crunchr

Figure 15: Questions to ask yourself | Source: RedThread Research, 2022.
Using a mature approach to DEIB metrics
The questions orgs should look to answer at this stage are:
- How can we address existing issues and drive our DEIB efforts effectively?
- How can we measure progress longitudinally?
- What creative analyses or approaches might help us answer questions we haven’t yet been able to answer?
When it comes to metrics and data, orgs should consider complementing existing data with:
- Network data
- Communication data from sources such as emails, calendars, meetings, etc.
- Workplace tech data from tools used by employees to get work done such as Zoom, SharePoint, Slack, Teams, and Asana
- Employee reviews and comments on external websites
Orgs should consider using advanced approaches to people analytics such as connecting text analytics with social network data. Text analysis can help orgs identify existing gaps in inclusion. Network analysis can help identify influencers. Orgs can relay feedback to influencers and leverage them to fill those gaps and drive greater efforts.
DEIB is a continuous effort rather than a “once-and-done” approach. Orgs should look externally to compare their performance to avoid becoming complacent in their efforts and update their goals regularly. Specifically, orgs should look at how other high-performing orgs that rank high on DEIB are performing, instead of industry or national averages.
“When it comes to selecting metrics, don’t go with the flow, and get something off the internet or another company. How you define metrics really matters, and orgs need to be intentional about what and how they measure them.”
—Lydia Wu, Head of Talent Analytics and Transformation, Panasonic North America

Figure 16: Questions to ask yourself | Source: RedThread Research, 2022.
Conclusion
When it comes to DEIB, orgs need to do more than provide training and courses to employees. They need to think about and approach it in a holistic manner so that it’s built into the way the business is managed, instead of something that’s an afterthought or special.
To that end, orgs need to:
- Understand where they currently stand and how are they perceived by their employees. They should know what issues currently exist.
- Understand why those issues exist. Orgs need to find out the reasons why they are falling short in those areas.
- Identify what can they do to fix them. Orgs should plan their targeted initiatives and interventions in order to get the maximum value and results from their efforts.
In order to achieve that, companies need to apply a greater focus, and put more emphasize on using metrics and data than they currently do. As we’ve mentioned before, the growing demands from customers, investors, and employees around more action on DEIB is likely to keep increasing. Orgs stand to lose a lot more if they do nothing, not just in terms of lagging performance, engagement, and innovation—but also in future talent that’s going to place a lot more importance on these issues going forward.
It's time companies take their DEIB data seriously. Moving forward, we hope to see a greater acceptance of and creative thinking around how these data and metrics can be used to enable all people and do their best work.
Appendix
Below we share our own as well as indices used by other organizations to help understand their DEIB culture.

Figure 17: RedThread’s DEIB index | Source: RedThread Research, 2022.

Figure 18: Gartner inclusion index | Source: Gartner.27

Figure 19: University of California San Francisco’s Belonging Index | Source: University of California San Francisco.28
L&D's DEIB Opportunity
Posted on Wednesday, February 2nd, 2022 at 6:23 PM
In the past 2 years or so, diversity, equity, inclusion, and belonging (DEIB) has—rightly—received more attention and investment than ever before. This trend isn’t about to stop: the most recent Edelman Trust Barometer indicated that well over half of employees, investors, and consumers are all making decisions in ways that push orgs to do more on DEIB. And more anecdotally (but also interesting), many of the 2022 predictions lists that have been circulating over the past couple of months have listed DEIB as a top trend for this year.
As orgs step up their DEIB efforts, we see a huge opportunity for L&D functions to do the same. With their reach across the org, their ability to influence org culture, and their responsibility to develop employees’ skills (including DEIB skills), L&D functions have incredible potential to influence the DEIB cultures of their orgs.
But that potential is, in our experience, largely untapped. L&D functions seem to be thinking too small. They’re staying in their DEIB comfort zone: compliance-oriented DEIB training. We think L&D functions need to think more deeply, expansively, and holistically about the impact they can have on DEIB.
That’s why we’ve just introduced a new research study on DEIB and the L&D function. We want to know: What are the most impactful things L&D functions can do to help build a strong DEIB culture in their orgs?
More specifically:
- What are forward-thinking L&D functions doing to build a DEIB culture in their orgs?
- What changes can L&D functions make—to themselves and to the ways learning happens—to have the biggest impact on the DEIB culture in their orgs?
- What are the major considerations that L&D functions should be taking into account if they’re just starting to expand their DEIB efforts?
This research continues a series of RedThread studies on different aspects of DEIB in the workplace, including:
- the skills employees at different levels need to drive a DEIB culture
- how to get started with DEIB analytics
- an overview of the DEIB tech market
We’re excited to dive in! If you’d like to learn more, we just published the premise of this research on our website. Check it out here.
The research will include a roundtable and 1 on 1 interviews—and we’d love for you to get involved. To participate in the study, please reach out to hello@redthreadresearch.com.
And finally, Don Taylor, a thought leader and researcher in the UK, is conducting his annual Global Sentiment Survey to figure out what L&D folks feel is hot this year. Click on this link to participate! It’ll take less than 30 seconds.