Events

People Analytics Technology: Landscape Tool

Posted on Tuesday, July 5th, 2022 at 7:33 PM    

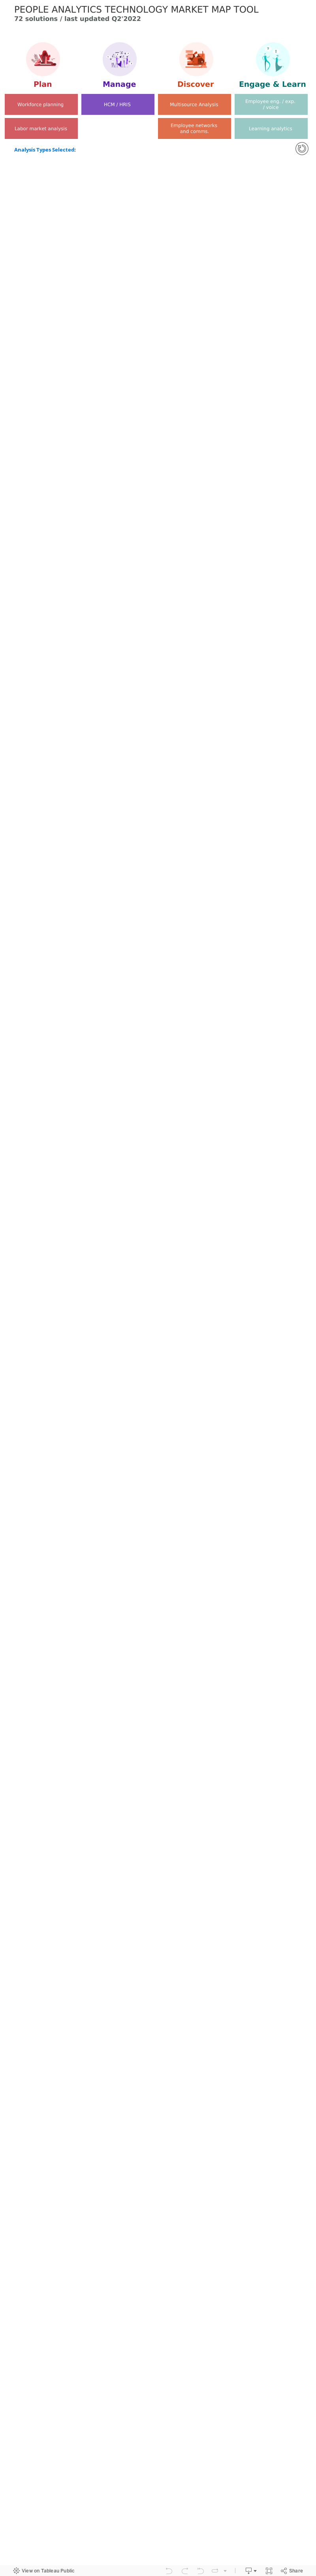
People Analytics Technology Tool

New vendors

If you would like to be included in our tool, please take our survey!

Existing vendors

If you are already included in our tool, but would like to share updated information, feel free to reach out to us!

Vendor Customers

Vendors: If you would like your customers to take our survey, please share the link below with them.

Existing customers: Are you an existing customer of one of the vendors in our tool? Tell us what you think! Take our survey.

Give feedback

We'd love your suggestions for how we can improve this tool.

New vendors

If you would like to be included in our tool, please take our survey!

Existing vendors

If you are already included in our tool, but would like to share updated information, feel free to reach out to us!

Customers

Vendors: If you would like your customers to take our survey, please share the link below with them.

Existing customers: Are you an existing customer of one of the vendors in our tool? Tell us what you think! Take our survey.

Give feedback

We'd love your suggestions for how we can improve this tool.


Quick Summary: People Analytics Technology Trends

Posted on Tuesday, June 21st, 2022 at 3:00 AM    

As leaders navigate uncertainty and volatility, they are increasingly turning to people analytics. As more and more organizations begin to leverage technology to support their people analytics efforts, it is crucial for them to understand the market.

This infographic (click on the image below to get the full version) is a summary of our report People Analytics Technology 2022.

As always, we’d love your feedback at [email protected]!


People Analytics Technology 2022: Full Report

Posted on Tuesday, June 14th, 2022 at 4:00 AM    

Download Report[/button]

Introduction

2021 brought its own set of challenges beyond the continuation of COVID-19: a rise in job resignations, the beginning of high inflation (which is still perniciously present), and the start-stop pattern of planning for hybrid work. Now that we are fully in 2022, we continue to manage those challenges, which are exacerbated by the persistence of COVID and its variants, the war in Ukraine with its far-reaching impacts, and a rise in commodity prices. Leading a business is never easy, but the past few years have been especially volatile.

To address this volatility, leaders have turned to people analytics like never before. When workers weren’t physically present, people analytics provided insights into their needs. When organizations needed to pivot to meet changing customer needs, people analytics helped leaders identify staff with the skills and capabilities to lead those efforts. And when leaders needed to understand why employees were leaving in droves, people analytics provided insights and helped stem the tide. In short, people analytics has been a beacon of rationality and calm in a world that has had little of either during the past few years.

For these reasons, understanding the people analytics technology (PAT) market is more important than ever. These PAT tools are helping millions of leaders make better choices about their people in a time when uncertainty and confusion can cloud decision-making capabilities. Therefore, understanding what’s happening in this market—and what needs to come next—are critical to leaders’ abilities to manage the next phase of volatility and uncertainty yet to come.

Figure 1: Methodology for People Analytics Tech Study 2022 | Source: RedThread Research, 2022.

This PAT study is our third and builds on the rich knowledge we’ve built up—as well as the feedback our readers have provided to us—over the last few years. As you see in Figure 1, our study relies on 2 vendor surveys, 1 customer survey, and hour-long briefings / demos with most participating vendors.

This study is designed to roll up our insights on the market broadly and provide information on the specific categories within it. For more about specific vendors, check out our People Analytics Tech tool, which vendors can update on a 24/7 basis.

As always, we aim to help you better understand the PAT market and, thus, enable you to make better people decisions with the help of technology. We are grateful to all the vendors and customers who participated in our study—and without whom this report wouldn’t be possible.

After reading this study, if you have further questions, then please reach out to us at [email protected].

Key findings

  1. Employee engagement and experience continue to be the biggest vendor category. Of the 58 vendors in our survey, a large percentage (42%) fall into the employee engagement and experience category—making it the biggest vendor area within our PAT study. It was also the dominating category in 2020, albeit with a smaller percentage of vendors (34%).
  2. 2021 saw the biggest market growth, along with high levels of investment. Based on our calculations, the PAT market size is $3 billion, with a growth rate of 53% for 2020–2021 and a 5-year compound annual growth rate (CAGR) of 80%. Among the vendors, 47% reported receiving investment funding in 2021.
  3. Prices for large customers have gone up. More vendors (34%) are now charging $500,000—$1,000,000 in subscription fees for companies with more than 50,000 employees, as compared with only 23% of vendors in 2020. Conversely, fewer vendors now serve smaller companies than in 2020.
  4. Vendors help customers by focusing on attrition and wellbeing. The vast majority of vendors (73%) reported attrition as a primary talent area of focus in 2021—with almost half also focused on wellbeing, an increase of 14% since 2020.
  5. Use cases are shifting over time, but vendors might be slow in responding. The shift in use cases comes as people analytics practitioners (PAPs) export data out of vendors’ systems for additional analysis in other tools, while non-PAP users increasingly rely on data for business decisions and adopt it Vendors should focus on non-PAP users to ensure continued usage.
  6. Data ethics and privacy are a priority for most vendors. More than 80% of vendors work with their customers to ensure compliance with different legal requirements in different regions and countries. Additionally, more than 70% design guidelines and policies—and align stakeholders around data collection, access, and sharing of insights.
  7. Customers are less satisfied than before, but vendors have high expectations for the future. Average customer Net Promoter Scores® (NPS) for vendors fell to 58 in 2022, as compared with 67 in 2021. Yet, 55% of vendors anticipate more than 30% growth for 2022.

Market trends

Employee engagement & experience continue to dominate the solution market

The largest vendor category (at 42%) in our study continues to be the employee engagement / experience / voice category. This is similar to our 2020 study in which 34% of vendors fell into this category—making it the most dominant (see Figure 2).

Figure 2: Vendor Solution Categories, 2021 vs. 2020*† | Source: RedThread Research, 2022.

We didn’t find this surprising for a few reasons:

  • Employee engagement / experience has become a top priority for organizations over the past 2 years. As we see in Figure 3, when we asked customers about the top challenges they’re trying to solve for, both employee engagement and experience were among the top 5.
  • The employee engagement / experience software market has traditionally been a busy space with growing potential. According to one source, the total investment made into this market in 2021 was more than $200 million and the total addressable market (TAM) for employee engagement solutions in 2022 is $77 billion. As surveying capabilities became a common commodity in the space, many vendors upped their game by adding measurement and analytics capabilities—thus moving into the people analytics space.

The percentage breakdown for the remaining categories remains similar to what we saw in 2020—suggesting that vendors are both continuing to focus on their areas of expertise and, as our data show later in this report, doubling down on differentiating themselves within their submarkets.

Figure 3: Top 5 Customer Challenges | Source: RedThread Research, 2022.

Real-World Threads

Foundry drives employee engagement by using a PAT solution

Foundry, a U.K.-based company that develops creative software for the digital design, media, and entertainment industries, faced a challenge—it lacked a safe space for employees to provide feedback.

In March 2020, Foundry embarked on its first-ever employment engagement survey using a PAT solution that focused on employee engagement.

The results showed that learning and development was one of the biggest areas of concern among employees. For example, more than half of those questioned (54%) agreed that good career opportunities existed for them at Foundry, while only 55% said they had access to the learning and development needed to do their jobs well.

Because of the insights from the data, the company was able to launch a series of efforts aimed at improving employee engagement. For example, the company revamped its internal movement policy with a fair application process to ensure that everyone has an equal opportunity in applying for any role.

It also put in place a mentoring plan that grew from an initial 20 pairings of mentors and mentees to 50 within the space of 12 months, along with the creation of Foundry Guilds—knowledge-sharing groups that bring together people with similar interests to talk about best practices and challenges.

As a result of its efforts, Foundry’s overall engagement score increased by 11% between the March 2020 and April 2021 surveys.

2021: The biggest market size yet with significant investment

The PAT market grew at an unprecedented rate in 2021. We calculated the market size at more than $3 billion for 2021 (see Figure 4). Overall, the market grew at the following rates:

  • 53% growth rate for 2020—2021
  • 80% CAGR (compound annual growth rate) for the past 5 years

Figure 4: PAT Market Size & Growth, 2016–2021* | Source: RedThread Research, 2022.

For those who read our 2020 research, you may notice that we’ve updated the revenue numbers for 2017—2020. This is because we have several new participants in our study and a number of older participants provided us with updated figures for previous years.

Vendors indicated that growth has been driven by both new and established customers which expanded their user base beyond people analytics practitioners (PAPs).

Growth’s also been partially driven by significant investments in the space. As Figure 5 shows, almost half of the vendors participating in our study received funding in 2021. Additionally, about one-third of vendors reported undergoing a merger, an acquisition, or some type of ownership change. This isn’t surprising as we know record investments ($30.8 billion by some estimates) had been made in work technologies in 2021.

Figure 5: Measuring How Growth Occurred in the PAT Market for 2021 | Source: RedThread Research, 2022.

Vendors are charging more & moving away from serving smaller companies

When we compare subscription fees vendors charged in 2021 with those of 2020, we observe (see Figure 6):

  • Vendors charge more for very large In 2020, 23% of vendors charged subscription fees in the range of $500,000—$1,000,000 for companies with more than 50,000 employees. In 2021, this increased to 34%.
  • Fewer vendors serve small and midsize A larger percentage of vendors no longer serve companies with fewer than 10,000 employees,:
    • 21% of vendors don’t serve small companies with less than 1,000 employees, as compared with 13% in 2020
    • 13% don’t serve midsize companies with 1,000—10,000 employees, as compared with 5% in 2020
    • Only 8% of vendors offer a low subscription fee of less than $50,000, as compared with 23% in 2020
    • 63% of vendors charge a higher ongoing subscription fee of $50,000—$100,000 for midsize companies, as compared with 43% in 2020

Figure 6: PAT Subscription Fee Range, 2021 vs. 2020* | Source: RedThread Research, 2022.

While the pandemic made people analytics a must-have for larger companies with enough resources, it’s possible that this also resulted in smaller companies putting their investments in PAT on the backburner since they likely had fewer resources to spare.

“ tool itself is totally effective, there might be 2 challenges: one is the pricing, and the other is consultancy required to effectively translate .”

—Large telecommunications company for an employee network and communications solution

2021 necessitated different approaches

Similar to 2020, vendors quickly responded to customer needs last year. The pandemic, growing resignation rates, and a shift from remote to hybrid work required leaders to seek insights–based on real-time data and from multiple sources–to make the best informed decisions.

Our data reveal that vendors responded to these needs. As with previous years, in 2021 vendors demonstrated a much clearer understanding of their own strengths and the characteristics that set them apart in the market.

As we see in Figure 7, in 2021 vendors differentiated themselves based on their data integration, collection, and engineering capabilities—as well as ease of use—as compared with 2020.

Figure 7: Changes in Primary PAT Capabilities | Source: RedThread Research, 2022.

Customers appreciated this. When asked about the strengths of the PAT solution they utilize, customers cited ease of use and data integration capabilities among the top 3 (see Figure 8). Additionally, many customers also listed advanced analytics as a top strength. This is likely because multisource analysis platform solutions—that offer predictive analytics, machine learning (ML), and artificial intelligence (AI)—received a significant number of customer feedback responses.

Figure 8: PAT Vendors’ Top 3 Strengths, According to Customers | Source: RedThread Research, 2022.

“Extremely knowledgeable team and focused feature set. Solves a massive integration problem that would be impossible otherwise.”

—Small real estate company for an employee engagement / experience / voice solution

Data ethics & privacy are a priority for most vendors, but only some are focused on education

When it comes to data ethics, security, and privacy, the majority of vendors take the lead in collaborating with their customers. As we see in Figure 9, more than 80% of vendors

comply with the different legal requirements in different regions and countries. (This does, of course, make us wonder what the other 17% are doing, but we will take that up with them separately!) Companies increasingly look to their technology partners to understand how policies differ across regions as well as their potential implications.

Figure 9: PAT Vendors’ Role in Data Ethics & Privacy* | Source: RedThread Research, 2022.

In addition, we also see that many vendors are working closely with their customers to design guidelines and policies, and align stakeholders around data collection, access, and sharing of insights.

The one area in which we see only some vendors taking the lead is education. Our data indicate that about half of vendors reported working with their customers to educate the broader organization on data ethics and privacy. This is a bit surprising and seems counterproductive to their other efforts in the area.

Without helping their customers gain an understanding of the complexities and legal challenges surrounding issues of data ethics, vendors may find it hard to align different stakeholders and move ahead with their work. It’s possible that vendors still see this as a job for the legal teams. However, as adoption of these tools scales across organizations, we hope to see more vendors envisioning this as an integral part of their role.

Use cases are shifting over time

Over the course of our conversations, we began to see that how organizations use PAT is changing, depending on the organization’s level of people analytics sophistication and the type(s) of users. Figure 10 is a simplified depiction of how organizations currently use these technologies.

  • Phase 1. PAPs use vendor tools for understanding a specific HR area (e.g., engagement), integrating data from other HR data sources (e.g., HRIS), and presenting it in dashboards; senior leaders begin to leverage dashboards.
  • Phase 2. PAPs use vendor tools to integrate a broader set of people-related data and some operational data, and provide a continuous stream of data; other leaders increasingly use these more robust dashboards and insights.
  • Phase 3. PAPs use vendor tools to export the integrated data, to add it to a data lake or run additional analyses on tools of their choice, such as Tableau and Power BI; leaders broadly adopt the dashboards and other capabilities to answer business questions.

As shown in Figure 10, once PAPs move to Phase 3, the level of usage of the tool declines for them. Importantly, though, this is when the tools can achieve broader scalability via adoption by business, HR, and people leaders—if the tools target those non-PAP audiences. Unfortunately, most don’t.

Figure 10: A Shift in Use Cases for PAT Solutions | Source: RedThread Research, 2022.

“Adding users is a bit cumbersome and, depending on the end-user, they may have some difficulty with understanding the complexity if there are a lot of dashboards / reports.”

—Small healthcare company for an employee engagement / experience / voice solution

Overall, customers aren’t as happy as before, but multisource analysis platforms are a bright spot

We saw a dip in customer satisfaction levels for 2021 when compared with 2020. Specifically, we saw a decline in NPS® from 67 in 2020 to 58 in 2021 (see Figure 11). This NPS is based on 21 vendors with 5 or more customer responses.

Figure 11: Average Customer NPS Score* | Source: RedThread Research, 2022.

A few potential reasons for the decline in NPS include:

  • Some vendors may not be doing enough to cater to the needs of non-PA leaders, resulting in a poor experience for them (see the first quote below)
  • The pandemic made everything urgent, which shortened the required timeline from deployment to insight: this may have been challenging for many vendors (see the second quote below)
  • With an increasingly crowded market space and rapid growth, theres growing competition, along with customers’ high expectations of vendors to provide unique and differentiating capabilities (see the third quote below)

Given that employee engagement / experience / voice and multisource analysis platforms (MSAPs) are the 2 biggest categories in our study, we analyzed those categories specifically to see if their customer NPS scores varied from the average. As you can see in Figure 12, on average, the multisource analysis platforms received an NPS score of 64, while vendors in the employee engagement / experience / voice category received an average NPS of 58, suggesting that customers are happier with MSAPs, as compared with other vendors.

Figure 12: Average Customer NPS Score for Multisource Analysis & Employee Engagement / Experience / Voice Platforms | Source: RedThread Research, 2022.

“The concept and idea is good, the analytics is good—but the content and features are not attractive for users.”

—Large technology company for an employee engagement / experience solution


“Flexibility is good for what you can build / do in the application. But for strategic workforce planning, it needs to be more robust and aligned to the overall WFP process if it wants to be a successful player in this competitive market.”

—Small healthcare company for an employee engagement / experience / voice solution


“They do not deliver the roadmap and are way behind what the competition can offer.”

—Large technology company for an employee engagement / experience solution

Vendors have high expectations for 2022 & made business changes to meet them

Vendors expect to see continued growth in the future. Specifically, for 2022 (see Figure 13):

  • All vendors expect growth of at least 6% or more
  • More than half of vendors expect growth greater than 31%

Figure 13: Growth Expected by Vendors in 2022* | Source: RedThread Research, 2022.

Our briefings revealed that vendors expect this growth to be driven by a few factors. Specifically, customers are:

  • Using people analytics to implement and manage hybrid work
  • Exhibiting a growing emphasis on using data and metrics for diversity, equity, inclusion, and belonging (DEIB)
  • Preparing for more SEC reporting requirements around human capital metrics

The optimism is perhaps also driven by business changes made by vendors to meet customer needs. Vendors reported that they (see Figure 14):

  • Adjusted their products, roadmap, and / or marketing strategy to meet the needs of the changing 2022 environment
  • Are offering greater technical and admin support, as well as resources, to customers as part of their subscription
  • Changed their sales and pricing models

Figure 14: Business Changes Made by Vendors for 2022 | Source: RedThread Research, 2022.

Our briefings also revealed that vendors are actively engaging with the wider customer community to understand emerging issues, and creatively working to help customers solve them—through better data capabilities, partnerships, and expansion into other talent areas. As customers face more nuanced challenges while navigating the complexities of hybrid work, we expect to see more vendors make such business changes.

Vendor capabilities

Vendors are helping solve current challenges

Vendors are actively working on solving the pressing challenges that organizations face today, such as (see Figure 15):

  • Managing employee engagement and experience. Similar to 2020, the top challenge is issues around employee engagement and experience.
  • Enabling action through insights. Companies need help identifying insights that can drive action, prioritizing efforts, and finding areas of need. Several vendors reported this as a primary challenge they’re helping to resolve.
  • Providing insights across areas. Companies need contextual insights to make better decisions―which means pulling in data from many different sources to get a holistic picture. Vendors are increasingly helping customers gain such insights.
  • Designing a data-based HR strategy. Several vendors report helping customers design an HR strategy based on data—linking talent and HR decisions to business outcomes, and identifying objective KPIs to track and measure.
  • Advanced workforce planning. The pandemic recast strategic workforce planning as a priority for companies. Additionally, the conversation around skills has accelerated, making workforce planning a top area of focus.

Figure 15: Top 5 Customer Challenges That Vendor Solutions Help Address | Source: RedThread Research, 2022.

Real-World Threads

C.H. Robinson uses PAT to design return-to-office policies
When the pandemic struck in early 2020, C.H. Robinson, a large transportation and logistics company, knew it needed to bring employees into the conversation. The company leveraged its employee engagement and experience solution to deploy pulse surveys in June 2020 and spring 2021 to measure employee sentiment about returning to work. The data collected from the surveys helped design the company’s plan for supporting new post-pandemic ways of working.

The data revealed that employees had mixed emotions about returning to the office. While about 50% of employees were comfortable with the idea, others were concerned about work-life balance and safety. Employees favored staggered scheduling, physical distancing, and frequent cleaning. The company decided to do a deeper dive into restructuring the post-pandemic work experience.

As a result of the data and feedback collected from employees, the Return to Office team partnered with executive leadership to develop a flexibility model using employee work personas—in-office, 2 hybrid groups, and remote workers. The goal was to ensure that all groups had the support and clarity they needed around how and where each group works.

The company also worked to create:

  • An Employee Experience Journey Map as a guide for understanding the emotional journey for both employees and managers
  • A more robust communication change management plan, targeting different messages to different personas

It also built resources for managers to have a reference for interacting with each of the different employee personas.

Vendors focused on areas of top priority

In addition to asking vendors about the primary challenges they’re helping to resolve, we also asked about the top areas of talent management on which their solutions are focused.

As we see in Figure 16, most vendors (73%) reported attrition and employee engagement as their primary areas of focus. Interestingly, attrition wasn’t even featured among the top 5 areas of primary focus for 2020. This increased attention isn’t surprising, though, when we consider that conversations around the “Great Resignation” dominated a good part of 2021.

Figure 16: Primary Talent Areas of Focus by Vendor Solutions, 2022 vs. 2020* | Source: RedThread Research, 2022.

Another unsurprising, but worth acknowledging, finding—almost half of the vendor solutions in our study now focus on employee wellbeing. The number of vendor solutions focusing on this area grew significantly from 34% in 2020 to 48% in 2021. This growth is primarily driven by the increase in vendors that focus on employee engagement and experience.

As companies continued with remote working in 2021, tracking and managing employee wellbeing has become an integral part of the employee experience. In this new era of growing focus on mental and physical health at work, it’s great to see vendors offer capabilities that allow customers to identify, solve for, and facilitate conversations around burnout, collaboration overload, and isolation.

Real-World Threads

CAPLAN corporation leverages PAT to understand attrition
CAPLAN corporation is an information technology and services company based out of Minato, Tokyo, Japan. The company faced a major hurdle in identifying the reasons for employee turnover as HR had no visibility into people data collected across the employee lifecycle. As a result, significant people decisions were being made solely based on intuition.

Leaders hypothesized that newer workforce members (those with the company for less than 3 years) quit the company at a higher rate. Additionally, they believed that issues with lack of transfers between merged entities within the company might be one of the reasons for the turnover.

Because the company lacked a PAT tool to help visualize the historical data on its employees’ career paths, leaders had no concrete way of testing the hypothesis.

The company decided to leverage a multisource analysis platform to help with the challenge. Connecting employee attributes data revealed that CAPLAN’s hypotheses around newer workforce leaving the company wasn’t true. In fact, the attrition rate for high-tenure employees was higher than that of newer employees. This helped the company realize that it needed to focus on cultivating the careers of the more tenured workforce.

Further, the company discovered that almost no personnel transfers existed between its merged companies. This confirmed for leaders that the company wasn’t functioning as a cohesive unit. By leveraging the PAT solution, CAPLAN found clarity and alignment on wider organizational issues that needed to be addressed to improve its people strategy and processes.

Vendors make it easier to connect data

One of the most positive findings from this year’s study is that vendors are making it easier for customers to pull data from different sources and technologies. As we mentioned earlier, customers also see this as a top strength of PAT solutions.

We expected to see the majority of vendors continue to use traditional methods, such as CSV or flat-file upload, to connect data with a few exceptions. Instead, we were pleasantly surprised to see that a large number of vendors have built API integrations, connectors, or some other designed integrations to pull continuous data from different systems.

As we see in Figure 17, almost 50% of vendors have designed integrations to connect data from HRIS systems. While CSV continues to be the method of choice for vendors integrating sales, CRM, and employee survey data, several vendors have built APIs for cloud-based technologies and learning systems. Particularly interesting, we found that more vendors have built APIs to integrate data from work technologies, such as email, Slack, and MS Office365, than use a flat-file upload. This makes sense, given the structure and continuous nature of the data.

Figure 17: Most Common Technologies With Which PAT Solutions Integrate | Source: RedThread Research, 2022.

Additionally, almost half of the vendors offer capabilities to integrate existing employee data with other internal and external sources (see Figure 18). As companies look to connect more and more data for better contextual insights, we expect to see these capabilities become tablestakes in the future.

Figure 18: Percentage of PAT Vendors That Integrate Internal & External Data | Source: RedThread Research, 2022.

“Insightful data, good user experience, seamless integration with IT.”

—SMB technology company for an employee engagement / experience / voice solution

Vendors may not be responding quickly enough to changes with end-users

The vast majority of vendors (93%) continue to focus on PAPs as their primary end-user (see Figure 19). Additionally, when compared with previous years, there’s a decline in usage frequency by all other groups except people managers.

Figure 19: Current End-Users, 2019 vs. 2020 vs. 2021* | Source: RedThread Research, 2022.

This growing gap is indicative of what we heard during our vendor briefings and found in our surveys. Vendors now understand the value propositions their solutions can provide for different users—but they’re not doing enough to attract greater usage from non-PAP users.

We heard from numerous vendors about their efforts to design user experiences around a specific set of users and provide them with targeted capabilities. However, given the significant gap in usage between PAPs and all other users, clearly vendors need to do more. For example, vendors should consider:

  • Surfacing relevant insights for HR and HRBP users that tie in directly with business priorities—benchmarking those against other business units and making it easy to share those insights more broadly
  • Giving tool access to employees, so they can see insights based on data collected about them and compare their own historical performance with that of other teams

For years vendors have said they would expand their end-user focus: We’re still waiting

In our first study in January 2019, we asked vendors the extent to which different users were current users and the extent to which those users would use the solution in 3 years’ time.

Well, now it’s nearly 3 years later. When we compare vendors’ predictions from 2019 about usage rates at the end of 2021 with the actual rates from the end of 2021, it’s a bit dismal (see Figure 20):

  • Business & C-suite leaders. The estimate from 3 years ago was 72%; actual usage is 51%
  • People managers. The estimate from 3 years ago was 81%; actual usage is 56%
  • Employees. The estimate from 3 years ago was 54%; actual usage is 23%

Figure 20: Current End-Users, 2021 vs. 2019 | Source: RedThread Research, 2022.

Here’s the really depressing part: All of those actual usage percentages for 2021 are lower than the actual usage numbers given in 2019.

With the near stagnant levels of usage by non-PA leaders and the shifting use cases we discussed earlier, vendors could face a real challenge if they don’t start providing value to non-PA leaders and thereby increase their usage.

C-suite leaders & employees are the most infrequent users of PAT insights

Current tool usage by non-PAPs has been stagnant for the past 3 years. This can be partially explained by the low frequency with which these groups use insights from their people analytics solutions.

In our survey, we asked vendors to tell us about the frequency of different users receiving and using the insights from their solutions, even if they don’t access the solution themselves. As we see in Figure 21, PAPs are at the top, with more than 60% of vendors reporting that PAPs receive insights from their solution on a daily or weekly basis. Given the critical role that people analytics can play for C-suite and business leaders, it’s surprising to see that only one-third of all vendor solutions provide these user groups with continuous insights. Even more depressing is the fact that only 19% of vendor solutions do this for employees.

Figure 21: Percentage of Vendors Indicating User Groups Receive Insights on a Daily or Weekly Basis | Source: RedThread Research, 2022.

As we’ve previously highlighted in our research, insights from people analytics can be crucial for driving the CEO’s agenda and making data-driven people decisions. The pandemic has made this all the more urgent and necessary. Similarly, the pandemic has changed the way employees feel about work. In a recent survey, 50% of employees agreed that the pandemic changed the expectations they have of their employers—one of which is their employer provides them with more control over their work. Sharing insights and data with employees is one way companies can do that.

“ has enabled us to transform to a data-driven HR organization. Not only the HR division makes use of it, it enables line managers unfamiliar with both data and HR to understand and incentivize, to look into their people data through a simple and beautiful UI/UX.”

—SMB media and entertainment company for a multisource analysis platform

Vendors need to offer more targeted capabilities for non-HR users

As we indicated earlier, the near constant level of usage by non-PA leaders could be due to the fact that vendors aren’t providing enough value to other user groups. One way vendors can do this is by providing targeted capabilities that help non-PA leaders use the tools for their own specific purposes. This includes providing them with insights that are relevant for them and are also based on their team data, as well as recommending actions suited to their roles and levels. Some vendors are doing this, but more needs to be done.

As we see in Figure 22, when it comes to non-HR users such as people managers, a little more than half of vendors report providing them with recommendations for relevant analyses. While this is certainly more than the number of vendors doing this for PAPs (34%), it’s not enough—people managers need more support and guidance when it comes to analytics.

Figure 22: Vendor Capabilities Offered by Vendor Solutions, HR Users vs. Non-HR Users* | Source: RedThread Research, 2022.

If the aim of people analytics is to drive decision-making by putting the right insights in the hands of the right people at the right time, then the majority of vendors are falling behind.

For non-technical users such as people managers who need to take action based on data, a tool that helps them to prioritize based on business needs is critical. Similarly, although 70% of vendor solutions provide customized insights to business and C-suite leaders, there’s certainly room for growth.

Real-World Threads

Uber puts people analytics in the hands of its people leaders
People data housed in different places and systems made it hard for Uber, a large mobility as a service company, to quickly conduct analyses on its workforce across the entire organization—and put needed insights in the hands of its leaders. Answering simple questions around headcount, for example, was often a challenge as no processes were in place to do such analysis on a repeatable and scalable manner.

The company decided to work with a vendor whose solution would allow comprehensive information on its people to be delivered to business leaders through an attractive and intuitive interface.

Uber wanted to empower all business leaders, not just HR leaders, with data and analytics. The company pursued a self-service model that enables users, rather than having a large analytics team do customized analyses with specialized tools and raw data.

The vendor helped design an “Uber People Dashboard” based on a previously used design that was tested with a group of users. The idea was to fast-track 80% of the solution, then iterate to get to a 95% solution by co-developing improvements.

Weekly feedback gathered from users showed that different user groups had very different needs. For example, leaders with small teams didn’t value analysis of headcount or past attrition as much as leaders with 200—300 employees. However, both types of leaders were interested in predictive analytics.

Uber rolled out its new people analytics solution to a broad group of business and HR users over a few quarters. Among business and HR users, more than 50% actively use the solution.

Understanding the PAT market: Our 2×2 matrix

A crowded marketplace

We continue to use our matrix approach to classifying the PAT market, for which we compare 2 aspects of solutions’ capabilities—usage frequency and data sources. (See Appendix 1 for more details; note that a firm’s placement up and to the right in the matrix is not necessarily better.)

The number of logos on our matrix (see Figure 23) has almost doubled since our first PAT study in 2019. A few things caught our attention this year:

  • The majority of new vendor participants have survey capabilities. In particular, we’ve seen a crowding of vendors in the 2 quadrants to the right of the Y axis, indicating a greater focus on more continuous analysis driven by employee listening.
  • More vendors are integrating data than before. We’ve observed the addition of vendors above the X axis, meaning a larger number of vendors are:
    • Pulling disparate internal organizational data (e.g., sales, CRM, learning data, etc.) as well as external data (e.g., labor market data)
    • Combining active data collected directly from employees with passive data, such as metadata or data from collaboration tools (e.g., Slack, MS Teams, etc.)

Figure 23: People Analytics Tech Market Solution Matrix | Source: RedThread Research, 2022.

(For information on individual vendors, see our People Analytics Tech vendor tool: https://redthreadresearch.com/pat-tool/)

Understanding the market

While the 2×2 matrix is helpful to understand market changes, it’s not necessarily as helpful as it could be to identify the vendors you need to do certain types of analysis. We have, therefore, for the first time with this research, also grouped vendors according to 4 categories of actions that they help practitioners perform (see Figure 24):

  • Plan. Vendors grouped under this category primarily concentrate on helping customers with strategic planning around their current and future workforce, based on internal organizational data and external labor market data. The subcategories within the plan category include:
    • Workforce planning
    • Labor market analysis
  • Manage. In this category, vendors focus on helping customers manage their existing talent by connecting different HR processes under one system. Currently, only one subcategory exists within this area:
    • HCM / HRIS
  • Discover. These vendors help customers discover and identify insights around their existing talent by connecting disparate data sources from HR, as well as non-HR systems. The subcategories include:
    • Multisource analysis platforms
    • Employee networks and communication
  • Engage & learn. Vendors in this category help customers understand their employees—and, thus, engage and develop them by bringing together data collected directly from employees, as well as data from systems in which they work. Subcategories are:
    • Employee engagement / experience / voice
    • Learning analytics

Figure 24: PAT Vendor Solution Categories | Source: RedThread Research, 2022.

Plan: Workforce planning

As shown in Figure 25, workforce planning technologies integrate data from a range of sources and are used often (depending on the organization’s current talent needs), but not continuously.

Specifically, workforce planning technology can:

  • Enable planning and finance professionals to identify the supply and demand of talent, and plan for current and future talent needs
  • Integrate internal HR data to identify needs with external labor market data to provide insights on workforce supply
  • Provide insights around internal mobility and skills identification

The workforce planning technology market tends to be hot when the talent market is at its extremes—either growing quickly (as we’ve seen for the last 18 months) or contracting rapidly (as we may see soon). It’s during extreme times of change—specifically the need to rapidly acquire talent or to determine which talent must be kept in times of layoffs—that leaders turn to the insights provided by workforce planning.

Figure 25: Workforce Planning Technologies | Source: RedThread Research, 2022.

That said, strategic workforce planning works best when it’s done on a regular basis. It takes consistent effort to understand specific talent markets, plan and execute talent strategies, measure change, and then make adjustments. One-off projects don’t fully leverage the power of strategic workforce planning. As data become easier to integrate, our expectation is that strategic workforce planning will be used more consistently within organizations.

“Increased collaboration and accountability (more people involved), increased availability of insights (faster analysis and planning), increased accuracy of workforce needed and its cost.”

—Small professional services company for a workforce planning solution

Plan: Labor market analysis

As shown in Figure 26, labor market analysis technologies integrate data and are used frequently, especially in hot talent markets. In particular, these technologies:

  • Collect and analyze external talent market data (e.g., from the S. Bureau of Labor Statistics, but also from LinkedIn and job boards) to help organizations with their current and future hiring needs
  • Help companies understand compensation trends
  • Provide insights into the types of talent that competitors are hiring and in which geographies

Figure 26: Labor Market Analysis Technologies | Source: RedThread Research, 2022.

We’re starting to see a focus on skills data by these vendors—a growing trend that’s being driven by the necessity to understand current skills and plan for needed future skills. As a result, we’re seeing labor market analysis platforms collate skills information for organizations from labor market data, such as job vacancy posts, to identify “in-demand” skills and general trends.

Also, we see more partnerships and integrations between labor market analysis platforms and other vendors, particularly those that integrate many data sources. For example:

  • Visier, a multisource analysis platform, partners with EMSI, a labor market analysis vendor, to help customers with job classification and insights on
  • Claro (recently acquired by WilsonHCG) feeds benchmarking data via a widget to another multisource analysis platform, eqtble, to provide customers with insights on the labor market next to their talent metrics.

This is a smart move as it not only allows vendors to leverage more data for better contextual insights, but also makes it easy for users to access more information in one place.

Manage: HCM / HRIS

As shown in Figure 27, HCM / HRIS analysis technologies are less uniform in their distribution on the matrix than are other categories due to how they’re used. Specifically, these technologies:

  • Provide analytics capabilities embedded as part of their HCM / HRIS solution
  • Target HR practitioners as their primary users
  • Cover many talent areas, including candidate selection, attrition, performance, DEIB, compensation / total rewards, and succession planning
  • Conduct analyses based on data primarily collected by the HCM system with capabilities to integrate additional data

A major benefit for customers that use the people analytics technologies offered by their HCM / HRIS systems is that they’re able to access all their data and analyses within one place. Further, they’re often also able to action decisions made as a result of analyses (i.e., increasing the compensation of certain people, approving promotions, or allocating budget for compensation increases). Also, fewer data security and privacy risks exist in this case as all data resides in one system.

The technologies in Figure 27 are leaders in the HCM space and have, in recent years, added people analytics capabilities as part of their solution offerings. For example:

  • ADP offers the ability for customers to integrate external data, as well as employee survey data, and provides insights geared toward front-line managers delivered via their mobile application
  • Workday HCM is able to integrate insights from its Workday Skills Cloud for customers, along with analyzing data from its HCM and financial systems

Figure 27: HCM / HRIS Platforms | Source: RedThread Research, 2022.

“So far, the solution has reduced manual tracking of many items. It has a very comprehensive amount of data collection for HR.”

—Small government / military organization for an HCM / HRIS solution

Discover: Multisource analysis platforms

As shown in Figure 28, multisource analysis platforms (MSAPs) tend to be used very frequently and integrate data from other systems. In some cases, MSAPs also create that data.

Specifically, these solutions can:

  • Integrate and analyze data from HR and other operational systems, and distribute insights at appropriate levels of security throughout the organization
  • Provide insights to people analytics and HR leaders—and, increasingly, to business leaders and managers
  • Offer data architecture capabilities along with a data warehouse for storage
  • Offer insights on the skills and behaviors being exhibited in organizations

Figure 28: Multisource Analysis Platforms | Source: RedThread Research, 2022.

By bringing together disparate data, MSAPs can create a single, integrated source of data truth that can then be used to answer critical questions about what’s happening with the workforce. Our research shows that effectively using integrated people analytics data can help impact businesses in terms of millions and sometimes billions of dollars. These significant business outcomes are typically the result of people analytics teams working to help answer strategic business questions, with the support of the CHRO and senior business leaders, who make the final decisions.

Yet, the people analytics team is only so big in any organization. By putting data into the hands of more business leaders, managers, and employees, organizations could enable more people to make better, data-backed decisions about people—and, thus, better enable those organizations (and people!) to thrive. This represents a critical future direction for MSAPs.

“It truly democratizes data in a self-service manner across the enterprise and enables people insights to be accessed at scale.”

—Large healthcare company for a multisource analysis platform

Discover: Employee networks & communications

As shown in Figure 29, vendors in this subcategory are mainly used on a continuous basis and can be both data creators as well as integrators. Specifically, the solutions in this space:

  • Collect passive data (from collaboration tools, emails, calendars, ) and / or active data (from surveys, forms, etc.) on employee networks to understand the relationships and collaborative behaviors among them
  • Target people managers, PAPs, and employees as users
  • Provide insights around DEIB, burnout, collaboration patterns and overload, isolation, and wellbeing
  • Offer some of the highest levels of security around data access and privacy due to the nature of data collected

These vendors offer what are commonly referred to as organizational network analysis (ONA) tools. Readers should notice that only one vendor is in the bottom left quadrant of Figure 29, Innovisor. Based on our last briefing with the vendor in 2019, it’s the only one in this subcategory that solely focuses on creating data by collecting information from employees via surveys. All other vendors in this space collect active as well as passive data (data from work technology and collaboration tools), and integrate the 2 data types to provide insights around employee networks.

Figure 29: Employee Networks & Communications Platforms | Source: RedThread Research, 2022.

ONA has become especially useful for organizations looking to understand how employee networks have changed over the last 2 years. We know that connections which are important for collaboration and innovation deteriorated with virtual work environments during the pandemic. We expect to see a continued focus on these tools in a hybrid work world as well.

Engage & learn: Learning analysis

As shown in Figure 30, learning analysis platforms tend to be used with different levels of frequency, depending on the vendor and its customers. These technologies can:

  • Provide customers with insights around employee learning, knowledge, and skills
  • Collect data from systems and tools that employees use to learn or work, such as multimodal learning resources (e.g., formal, informal, and on-the-job learning), and employee behavior and performance data
  • Help admins understand utilization and cost implications of different platforms

Figure 30: Learning Analysis Technologies | Source: RedThread Research, 2022.

The learning analysis category is sparse because these technologies are still a bit of a niche offering. Many learning organizations are not very mature at using analytics, continuing to rely on Kirkpatrick Level 1 “smile” sheets or rudimentary analysis run in Excel. Further, learning analytics aren’t often within the purview of people analytics practitioners, so PAPs haven’t necessarily been a potential buyer of these technologies.

All that said, there’s clearly a need for learning analysis technologies. For example, as we think about the big push toward understanding skills, a critical part of “upskilling” is in understanding which learning experiences actually drive the acquisition of critical skills sets and the timeline on which those are acquired. Further, as organizations are analyzing how learning happens with hybrid work, they’ll need more sophisticated tools to measure effectiveness. Learning analysis platforms have the potential to provide this type of insights.

Engage & learn: Employee engagement / experience / voice

Representing 42% of the vendors in this year’s survey, employee engagement / experience / voice platforms create data and, in some instances, integrate data from other systems (see Figure 31). They tend to be used very frequently by organizations. Specifically, they can:

  • Help companies track and manage employee engagement, experience, and voice
  • Collect active data from employees via engagement surveys, pulse surveys, and / or feedback forms
  • Collect and integrate passive data from collaboration tools (such as Slack, MS Teams, emails, calendars, )
  • Integrate HR data with non-HR data, such as information from sales and CRMs

The employee engagement / experience / voice category has experienced some of the most significant growth during the pandemic. It’s also seen some of the greatest market activity in the last few years—with Workday purchasing Peakon, Perceptyx purchasing Waggl and Cultivate, and Visier purchasing Yva.ai.

Figure 31: Employee Engagement / Experience / Voice Platforms* | Source: RedThread Research, 2022.

*Yva was acquired by Visier during the compilation of this report. Although it’s featured under “Engage & Learn” in this report, moving forward it’ll be covered in the “Discover” category.

We expect to see employee engagement / experience / voice vendors continuing to augment their survey data (which measure perceptions) with passive “objective” data (that reflects what’s actually happening). This passive data will almost certainly come from collaboration analytics tools—which use the metadata from work tools such as Slack, MS Teams, emails, and calendars, to understand how people work together. Therefore, we also expect to see some action with other vendors in this space, such as Glickon, Network Perspective, RSquared, Swoop Analytics, and Worklytics.

"They are great to work with and the tool works for what we need it for, but still would like the experience side and the engagement side to talk to each other.”

—Large healthcare company for employee engagement and experience solution

Final thoughts

What’s next for the PAT market?

We foresee a few trends for this tech market in the near future.

  • More use of collaboration and digital exhaust. The market is clearly headed in this direction—the recent acquisition of Yva.ai by Visier is an indicator of this. Employers increasingly want to understand how their people work and collaborate, especially in a hybrid world of work. The combination of passive data with active data can help leaders better understand how work gets done.
  • Widgetization of one technology into another. As more and more vendors partner with each other, they look for ways to make it easy for customers to access the different insights. We’re starting to see this with vendors integrating their tools into other software, similar to embedding a We expect to see more vendors adopt this approach to provide customers with greater contextual insights.
  • More partnerships between vendors. We’re already seeing a large number of PAT vendors from different categories partner with each other to provider a broader set of capabilities to their customers. For example:
    • Visier has partnerships in place with Medallia and EMSI
    • Medallia has a partnership with Humanyze

We expect to see such partnerships become more commonplace as organizations adopt hybrid work models, and require new and different types of data to understand and manage their workforce.

Wrapping up

People analytics continues to be a guiding light for many in these turbulent times. Findings from our research show that the PAT market continues to gain momentum and grow stronger. Even though our data revealed lower customer satisfaction scores than we’ve seen in the past, we’re optimistic about the market, and believe in its ability to help lead organizations by separating fact from fiction and myth.

Our vendor briefings and conversations with practitioners further strengthen our belief that the market is moving in the right direction when it comes to solving the toughest challenges faced by its customers, such as:

  • Integrating disparate data
  • Managing employee wellbeing and attrition
  • Understanding skills
  • Providing advanced analytics capabilities to answer workforce-related questions

Vendors are highly optimistic about the future and anticipate more growth moving forward. There’s certainly a growing appetite to work with people data within organizations. We look forward to continuing to watch this market and how it evolves in the coming months, and reporting these changes to you next year.

Appendices

Appendix 1: Summary of methodology

This study is a culmination of 5 months of qualitative and quantitative research (see Figure 32).

Figure 32: Methodology for People Analytics Tech Study 2022 | Source: RedThread Research, 2022.

We kicked off our People Analytics Technology study early in 2022—and did a few things differently this year. For example, vendors were required to complete 2 surveys, Vendor and Market, in order to participate in the study (instead of 1 robust survey as in the past). A couple of reasons for this include:

  • Having 2 separate surveys allowed us to capture information and compartmentalize it between market trends and vendor trends more While the majority of findings from the Market survey are included in this report, the information from the Vendor survey are shared in our updated PAT tool.
  • Going forward, our Vendor survey will remain live 24/7—allowing vendors to update us about changes to their solutions as and when they happen, without waiting a full year. The Market survey will be conducted annually.

Similar to previous years, we conducted 60-minute live briefings with 40 vendors and reviewed recorded briefings for 3 of them (vendors had the option of providing prerecorded briefing videos if they preferred). The briefings took place from January to April 2022.

In addition, we also conducted a customer survey. Customers were asked to:

  • Share the challenges they’re using the solution to solve
  • Give feedback on the vendor’s strengths and areas of improvement
  • Determine a customer Net Promoter Score® (NPS) for their vendor

Vendors were also asked to share case studies, representative screenshots of their technologies, and logos with us.

Each vendor was required to receive a minimum of 5 customer reviews to be included in our study, with no limit on how many reviews they could receive. We received 5 or more customer reviews for 21 vendors as of the end of March 2022.

A total of 43 vendors completed our surveys. In addition, publicly available data for 15 vendors were included in the dataset, bringing the total n to 58.

2×2 matrix

Once our qualitative and quantitative data collection and analysis were complete, we revisited the 2×2 matrix that we introduced in our 2019 report. Our matrix compares 2 aspects of vendors’ capabilities—usage frequency and data sources. This approach allows us to identify some points of differentiation and categorize vendors in different, meaningful segments.

Understanding the X-axis

Starting with the X-axis (see Figure 33), we range from solutions that users tend to use / access on a frequent basis (e.g., quarterly, bimonthly, or monthly) on the left side of the matrix to solutions that are used on a continuous / always-on basis (e.g., biweekly, weekly, or daily) on the right. Please note: We’re specifically thinking about how frequently users tend to utilize the solution, not the frequency with which it’s updated or can give insights. We focused on user frequency because it allows us to understand, from a practitioner’s perspective, how frequently a solution tends to be used— which can help us understand how and by whom it’s used.

Figure 33: Details of the X Axis from the People Analytics Technology Market Solution Matrix | Source: RedThread Research, 2022.

For example, the solutions on the left side of the model tend to be used to consistently check in on specific areas of interest. These are leveraged by HR, people analytics, and other business leaders who are looking to make strategic talent decisions.

As we move toward the right, we see solutions that both provide analysis for strategic, organizational decision-making, and inform users about themselves or their team. Many of these solutions’ typical primary users are people analytics or HR—but the vendors have expanded (or are in the process of expanding) their user groups to include senior leaders, managers, and employees.

On the far-right side of the graphic are solutions that both tend to be used more continuously, which lend themselves to more operational (nonstrategic) adjustments, and alert individuals about their own or their team’s behavior. Obviously, when this type of data is pulled together and analyzed longitudinally, it could inform strategic decision-making as well. These vendors tend to focus more on providing greater accessibility to data and sharing insights directly with employees in the form of nudges, individual reports and dashboards, and notifications.

Understanding the Y-axis

On the Y-axis, we classify solutions as follows—from whether vendors collect (via any method) and “create” the data themselves, as shown at the bottom of the graphic, to whether they integrate the data from other sources (e.g., government data, other third-party solutions, or other internal technologies), shown at the top of the graphic. Note that almost every vendor in our study pulls data from the HR information system (HRIS) for basic demographics, hierarchy, location, and other facts, so we don’t “count” integration with HRIS as one of the integrations on this axis.

Figure 34 indicates how the scale changes. At the bottom of the model, we have solutions that “create” data primarily by collecting it directly from employees (i.e., engagement, onboarding, exit surveys, etc.). Moving up the axis, we add in solutions that collect data as well as integrate other data captured on employees, such as wellbeing or performance management data, via their own tools.

Figure 34: Details of the Y Axis from the People Analytics Technology Market Solution Matrix | Source: RedThread Research, 2022.

Moving up further (closer to the X-axis), we have solutions that still capture data but also integrate a wide range of data sources (e.g., 360-feedback data, financial / business outcome data, work productivity data like email or Slack / MS Teams, and customer experience data).

Finally, toward the top third of the Y-axis, we have solutions that primarily integrate data from others. Unlike those on the bottom, the majority of these solutions don’t offer the capability to collect data. A number of them work in tandem with those lower down on the matrix as part of the bigger people analytics technology ecosystem.

When we put all of this together, we end up with 4 different quadrants with distinct characteristics (see Figure 35):

  • Accumulated analytics. Vendors in this quadrant rank high in their ability to provide users with a longitudinal view of data, including insights that enable strategic talent decisions. Data tend to be aggregated and integrated from several sources, including external data. The insights from these vendors can be used by teams on a frequent basis to track specific areas of interest.
  • Snapshot analytics. Vendors in this quadrant are data collectors and provide insights that are reviewed for strategic talent decisions on an event-driven basis. These vendors are primarily focused on active data collection, though they may also have some newly introduced data integration capabilities.
  • Targeted analytics. This quadrant includes vendors that focus on a specific talent area (e.g., engagement / experience, performance management, wellness). They collect data directly from employees—enabling both quicker deployment and adoption, and access to insights and analysis by multiple teams on a very frequent or continuous basis. Several of them push insights directly to employees to promote faster action.
  • Guiding analytics. This quadrant includes vendors that integrate data from several different sources and which are used very frequently to continuously. This combination of elements enables users to frequently access deep and broad information that can guide strategic organizational decisions, operational decisions, and individual’s decisions about themselves or their team. Our mental model for solutions in this section is like a guided missile—they can give insights that can change the trajectory quickly.

Figure 35: People Analytics Technology Market Solution Matrix | Source: RedThread Research, 2022.

It’s important to note that none of these quadrants is superior to the others. In fact, there’s likely a place for all of them in an organization’s people analytics technology ecosystem. However, by putting technologies into these boxes, we can start to think about what that ecosystem might look like and how organizations might begin to build them.

Appendix 2: Vendor demographics

This year, a total of 43 solutions participated in our study. We included publicly available information for an additional 15 vendors, bringing the total to 58. The demographic breakdown of survey participants by year founded, number of employees, and HQ location is shown in Figures 36–38.

Figure 36: Vendor Founding Year, 2022 | Source: RedThread Research, 2022.

Figure 37: Vendor HQ Locations, 2022 | Source: RedThread Research, 2022.

Figure 38: Number of Employees for Vendors, 2022 | Source: RedThread Research, 2022.

Appendix 3: Customer demographics

We received a total of 128 customer responses. The demographic breakdown for the customer respondents by industry, roles, and number of employees is shown in Figures 39–41.

Figure 39: Customer Respondent Industries, 2022* | Source: RedThread Research, 2022.

Figure 40: Role / Job Functions of Customer Respondents, 2022 | Source: RedThread Research, 2022.

Figure 41: Number of Employees for Customers, 2022 | Source: RedThread Research, 2022.


People Analytics Technology 2022: Executive Summary

Posted on Tuesday, May 17th, 2022 at 9:00 AM    

Summary of findings

  1. Employee engagement and experience vendors continue to dominate the PAT market. A full 42% of vendors in this year’s people analytics technology (PAT) study are in the employee engagement and experience category. In 2020, this percentage was 34%—but even then, it was still the dominant category.
  2. The PAT market size and level of are at their highest levels to date. The market grew at an unprecedented rate, with a 53% growth rate between 2020 and 2021, and an 80% CAGR (compound annual growth rate) for the past 5 years. We estimate the overall market value at just over $3 billion. Almost half (47%) of vendors reported receiving investment in 2021, while 30% were acquired, bought another company, or experienced an ownership change.
  3. Vendors differentiate themselves as new challenges arise. Vendors helped customers meet their data challenges in 2021 by focusing on data engineering, collection, and integration capabilities. This contrasts with 2020, when most vendors differentiated themselves on the methodology, expertise, and science they brought to the table.
  4. Use cases are shifting, but vendors are likely not responding fast enough. In 2021, vendors continued to focus on serving people analytics practitioners (PAPs). However, our analysis reveals that, as customers’ level of data sophistication increases, the value of PAT is often in the scaling of insights outside the people analytics team. Vendors need to provide capabilities for non-PA practitioners or risk losing the ability to expand their offerings. Today, only 56% of vendors report people managers as current end users, 51% report business and C-suite leaders, and only 23% say the same for employees.
  5. Customers are less satisfied than before, but that might change in the future. The average Net Promoter Score® score (based on customer responses) dropped to 58 in 2021, as compared with 67 in 2020. The good news is that vendors are actively responding to customers’ needs in 2022. Fifty-seven percent of vendors said that they built new solutions or products for customers, or adjusted their product roadmap. More than 30% of vendors now offer greater technical and administrative support and resources to meet customer needs.

Introduction

2021 brought its own set of challenges beyond the continuation of COVID-19: a rise in job resignations, the beginning of high inflation (which is still perniciously present), and the start-stop pattern of planning for hybrid work. Now that we are fully in 2022, we continue to manage those challenges, which are exacerbated by the persistence of COVID and its variants, the war in Ukraine with its far- reaching impacts, and a rise in commodity prices. Leading a business is never easy, but the past few years have been especially volatile.

To address this volatility, leaders have turned to people analytics like never before. When workers were’t physically present, people analytics provided insights into their needs. When organizations needed to pivot to meet changing customer needs, people analytics helped leaders identify staff with the skills and capabilities to lead those efforts. And when leaders needed to understand why employees were leaving in droves, people analytics provided insights and helped stem the tide. In short, people analytics has been a beacon of rationality and calm in a world that had little of either during the past few years.

For these reasons, understanding the people analytics technology (PAT) market is more important than ever. These tools are helping millions of leaders make better decisions about their people in a time when uncertainty and confusion can cloud decision-making capabilities. Therefore, understanding what’s happening in this market—and what needs to come next—isn’t just interesting, but critical to leaders’ ability to manage the next phase of volatility and uncertainty.

This executive summary contains some of our main findings from this year’s study. We share more details in our People Analytics Technology Report that RedThread members can access on our website. We also plan to launch an updated PAT tool on our website with much content available for both members and nonmembers.

We hope the findings in this executive summary provide you with better clarity about the evolving market, its areas of focus, and how your organization can solve your people-related challenges.

Thank you to all the vendors and customers who participated in this year’s study. Your support is critical to us being able to do this work. Thank you, also, to our research members; without your support, our work would not be possible.

Employee engagement & experience continue to dominate the solution market

This year’s study is composed of 58 solution vendors, although we know there are more than 125 vendors in this market. Within our study, the largest vendor category (42%) serves the employee engagement, experience, and voice space. This was also the dominant category in 2020 as well, although it then had just 34% of vendors (see Figure 1).

Figure 1: Vendor Solution Categories, 2021 vs 2020* | RedThread Research, 2022.

The dominance of this category wasn’t surprising for a few reasons:

  • Employee engagement and experience was a critical area of concern for companies during the pandemic, giving vendors an even greater impetus to focus on it.
  • The employee engagement and experience software market has traditionally been a crowded space and many vendors (primarily survey providers) have quickly added analytics capabilities recently, thus moving into the people analytics space.

The percentage breakdown for the remaining categories was similar to what we saw in 2020, suggesting that vendors continued to focus on their areas of expertise and, as our data shows later in this report, doubled down on differentiating themselves within their submarkets.

2021: Biggest market size yet

The PAT market grew at an unprecedented rate in 2021.* We calculated market size at just over $3 billion for 2021 (see Figure 2). Overall, the market grew at the following rates:

  • 53% growth rate for 2020-2021
  • 80% CAGR (compound annual growth rate) for the past 5 years

Figure 2: PAT Market Size, 2016-2022 | RedThread Research, 2022.

Vendors indicated that growth was driven by both new and established customers which had expanded their user base beyond people analytics practitioners (PAPs).

These growth sources align with other research that found organizations requested talent metrics to a greater extent than before the pandemic and planned to increase the size of their people analytics teams in 2021.

For those who read our 2020 research, you may notice that we’ve updated the revenue numbers for 2017-2020. This is because we have several new participants in our study and a number of older participants provided us with updated figures for previous years.

Figure 3: PAT Market Growth* | RedThread Research, 2022.

2021: A busy year with significant investment

Market growth was at least partially driven by significant investments in the space. As Figure 4 shows, almost half of the vendors that participated in our study received funding in 2021. About one-third of the vendors reported undergoing a merger, an acquisition, or some type of ownership change. Our findings align with the trends in the overall HR tech market, which saw a surge in investments during 2021.

Figure 4: Investments in the PAT Market in 2021 | RedThread Research, 2022.

In addition, vendors expect to see continued growth in this area well into the future. Specifically, for 2022 (see Figure 5):

  • All vendors expect growth of at least 6% or more
  • More than half of vendors expect growth greater than 31%

Our briefings revealed that vendors expect this growth to be driven by a few factors. Specifically, customers are:

  • Using people analytics to implement and manage hybrid work
  • Exhibiting a growing emphasis on using data and metrics for diversity, equity, inclusion, and belonging (DEIB)
  • Preparing for more SEC reporting requirements around human capital metrics

Figure 5: Growth Expected by Vendors in 2022* | RedThread Research, 2022.

A crowded marketplace

We continue to use our matrix approach to classifying the PAT market, for which we compare 2 aspects of solutions’ capabilities: usage frequency and data sources (see Appendix 1 for more details; note that a firm’s placement up and to the right in the matrix is not necessarily better).

The number of logos on our matrix (see Figure 6) has almost doubled since our first PAT study in 2019. A few things caught our attention this year:

  • The majority of new vendor participants have surveying capabilities. We’ve particularly seen a crowding of vendors in the 2 quadrants to the right of the Y axis, indicating a greater focus on more continuous analysis driven by employee listening.
  • More vendors are integrating data than before. We’ve observed the addition of vendors above the X axis, meaning a larger number of vendors are:
    • Pulling disparate internal organizational data (e.g., sales, CRM, learning data, etc.) as well as external data (e.g., labor market data)
    • Combining active data collected directly from employees with passive data, such as metadata or data from collaboration tools (Slack, Teams, etc.)

Figure 6: People Analytics Tech Market Solution Matrix | RedThread Research, 2022.

2021 necessitated different approaches

Similar to 2020, vendors were quick to respond to customer needs last year. The pandemic, growing resignation rates, and a shift from remote to hybrid work meant that leaders needed insights based on real-time data from multiple sources to make informed decisions.

Our data reveal that vendors responded to these needs. Compared to previous years, in 2021, vendors had a much clearer understanding of their strengths and what set them apart from other vendors.

As we see in Figure 7, in 2020 vendors focused on differentiating themselves based on their domain expertise and methodology. In 2021, they differentiated themselves based on their data integration, collection, and engineering capabilities, while keeping the solutions flexible and easy to use.

However, while these capabilities met a critical need of the primary users of the solution, they fell short of meeting the needs of other users, as our data show on the next few pages.

Figure 7: Changes in Primary PAT Capabilities | RedThread Research, 2022.

Use cases are shifting over time

Over the course of our conversations, it became clear that there is a change in how organizations are using people analytics technologies, depending on the organization’s PA sophistication and the type of user. Figure 8 is a simplified depiction of how many organizations are using these technologies:

  • Phase 1: PAPs use vendor tools for understanding a specific HR area (e.g., engagement), integrating data from other HR data sources (e.g., HRIS), and presenting it in dashboards; senior leaders begin to leverage dashboards.
  • Phase 2: PAPs use vendor tools to integrate a broader set of people-related data and some operational data, and provide a continuous stream of data; other leaders increasingly use these more robust dashboards and insights.
  • Phase 3: PAPs use vendor tools to export the integrated data, and add it to a data lake or to run additional analysis on the tools of their choice, such as Tableau and Power BI; leaders broadly adopt the dashboards and other capabilities to answer business questions.

As shown in Figure 8, once PAPs move to Phase 3, the level of usage of the tool declines for them. Importantly, though, this is when the tools can achieve broader scalability via adoption by business, HR, and people leaders—if the tools target those non-PAP audiences. Unfortunately, most do not.

Figure 8: A Shift in Use Cases for PAT Solutions | RedThread Research, 2022.

Vendors may not be responding quickly enough to changes with end users

The vast majority of vendors (93%) continue to focus on PAPs as their primary end user (see Figure 9). Additionally, when compared with previous years, there’s a decline in usage frequency by all other groups except people managers.

This growing gap is indicative of what we heard during our vendor briefings and found in our surveys. Vendors now understand the value propositions their solutions can provide for different users—but they’re not doing enough to attract greater usage from non-PAP users.

We heard from numerous vendors about their efforts to design user experiences around a specific set of users and provide them with targeted capabilities. However, given the significant gap in usage between PAPs and all other users, clearly vendors need to do more. For example, vendors should consider:

  • Surfacing relevant insights for HR and HRBP users that tie in directly with business priorities, benchmarking those against other business units and making it easy to share them more broadly
  • Giving tool access to employees so they can see insights based on data collected about them and compare their own historical performance with that of other teams

Figure 9: Current End Users, 2021 vs 2020 vs 2019* | RedThread Research, 2022.

For years vendors have said they would expand their end-user focus: We’re still waiting

In our first study in January 2019, we asked vendors the extent to which different users were current users and the extent to which those users would use the solution in 3 years’ time.

Well, it’s nearly 3 years later. When we compare vendors’ predictions from 2019 about usage rates at the end of 2021 with the actual rates from the end of 2021, it’s a bit dismal (Figure 10):

  • Business & C-suite leaders: The estimate from 3 years ago was 72%; actual usage is 51%.
  • People managers: The estimate from 3 years ago was 81%; actual usage is 56%.
  • Employees: The estimate from 3 years ago was 54%; actual usage is 23%.

Here’s the really depressing part: All of those actual usage percentages for 2021 are lower than the actual usage numbers given in 2019.

With the near stagnant levels of usage by non-PA leaders and the shifting use cases we discussed earlier, vendors could face a real challenge if they don’t start providing value to non- PA leaders and thereby increase their usage.

Figure 10: Current End Users, 2021 vs 2020 vs 2019 | RedThread Research, 2022.

Customers are not as happy as before

We saw a dip in customer satisfaction levels for 2021 when compared with 2020. Specifically, we saw a decline in NPS from 67 in 2020 to 58 for 2021 (see Figure 11). This NPS is based on the 21 vendors with 5 or more customer responses.

Figure 11: Average Customer NPS Score | RedThread Research, 2022.

A few potential reasons for the decline in NPS include:

  • Some vendors may not be doing enough to cater to the needs of non-PA leaders, resulting in a poor experience for them

“The concept and idea is good, the analytics is good—but the content and features are not attractive for users.”
—Large technology company for an employee solution experience / engagement solution

  • The pandemic made everything urgent, which means customers needed solutions to deliver on their promises and provide updates in a much shorter This may have been challenging for many vendors

“Flexibility is good for what you can build / do in the application, but for Strategic Workforce Planning it needs to be more robust and aligned to the overall WFP process if it wants to be a successful player in this competitive market.”
—Midsize transportation company for a workforce planning solution

  • With an increasingly crowded market space and rapid growth, there’s growing competition, along with customers’ high expectations of vendors to provide unique and differentiating capabilities

“They do not deliver the roadmap and are way behind what the competition can offer.”
—Large technology company for an employee solution experience / engagement solution

Vendors made business changes for 2022

Even though customer satisfaction levels were lower in 2021, we expect to see improvement in the future as vendors make investments to better meet customers’ needs in 2022.

Specifically, our findings reveal that in 2022 vendors (Figure 12):

  • Adjusted their products, roadmap, and / or marketing strategy to meet the needs of the changing 2022 environment
  • Offered greater technical and admin support as well as resources to customers as part of their subscription
  • Changed their sales and pricing models

This is good news. Vendors are applying a multipronged approach to making business changes. Our briefings also revealed that vendors are actively engaging with the wider customer community to understand emerging issues, and are working creatively to help customers solve them through better data capabilities, partnerships, and expansion into other talent areas. As customers face more nuanced challenges while navigating the complexities of hybrid work, we expect to see more vendors make such in-house business changes.

Figure 12: Business Changes Made by Vendors for 2022 | RedThread Research, 2022.

Conclusion

Events of the past 2 years have made people analytics vital for organizations. Leaders relied on people analytics for various efforts, including:

  • Improving employee safety, health, and experience as they worked remotely during the pandemic
  • Planning current and future workforce, and understanding attrition from large numbers of resignations
  • Planning for hybrid work

This is reflected in how this market is thriving, with its impressive growth rate and the high number of investments made in vendors during 2021.

That’s not to say the market doesn’t face challenges. The crowded landscape means vendors will find it increasingly difficult to set themselves apart from the competition in the future. Additionally, as we saw, customers are less satisfied when compared with our 2020 findings.

As we move ahead, vendors will have to become much more distinct in their value propositions, especially for non-PA end users. If they don’t, then vendors may be unable to grow at the rates they (and their investors) are hoping for. The challenge for 2022 is to bring the right insights at the right time to the right audience. We look forward to seeing how vendors fare during the next year.

Appendix 1: Methodology

This study is a culmination of 5 months of qualitative and quantitative research. We kicked off our People Analytics Technology study early in 2022 by launching our Vendor and Market surveys. In order to

participate in our study, vendors had to complete both surveys. They were also asked to share case studies, representative screen shots of their technology, and logos, and complete a 60-minute briefing and demo with us. The vendors had the option of providing prerecorded briefing videos if they preferred. The briefings took place from January to April 2022. A total of 43 vendors completed our surveys. In addition, publicly available data for 15 vendors were included in the dataset, bringing the total n to 58.

On the practitioner side, we launched a short People Analytics Technology Customer Poll in January 2022. Customers were asked to share the challenges they’re using the solution to solve, give feedback on the vendor’s strengths and areas of improvement, and provide a Net Promoter Score and any other feedback. Each vendor was required to receive a minimum of 5 customer reviews to have customer information be included in our study; there was no limit on how many reviews they could receive. We received 5 or more customer reviews for 21 vendors as of the end of March 2022.

2×2 matrix

Once our qualitative and quantitative data collection and analysis were complete, we revisited the 2×2 matrix that we introduced in our 2019 report. Our matrix compares 2 aspects of vendors’ capabilities: usage frequency and data sources. This approach allows us to identify some points of differentiation and categorize vendors in different, meaningful segments.

Understanding the X-axis

Starting with the X-axis, (see Figure 13), we range from solutions that users tend to use / access on a frequent basis (e.g., quarterly, monthly, or bimonthly) on the left side of the matrix to solutions that are used on a continuous / always-on basis (e.g., weekly, biweekly, or daily) on the right. Please note: We’re specifically thinking about how frequently users tend to utilize the solution, not the frequency with which it’s updated or can give insights. We focused on user frequency because it allows us to understand, from a practitioner’s perspective, how frequently a solution tends to be used—which can help us understand how and by whom it’s used.

For example, the solutions on the left side of the model tend to be used to consistently check in on specific areas of interest. These are leveraged by HR, people analytics, and other business leaders looking to make strategic talent decisions.

As we move to the right, we see solutions that are trying to both provide analysis for strategic, organizational decision-making, and inform users about themselves or their team. Many of these solutions’ typical primary users are people analytics or HR, but the vendors have expanded or are in the process of expanding their users to senior leaders, managers, and employees.

On the far-right side of the graphic are solutions that tend to be used more continuously, which lend themselves to more operational (nonstrategic) adjustments, and alert individuals about their own or their team’s behavior. Obviously, when this type of data is pulled together and analyzed longitudinally, it could inform strategic decision-making as well. These vendors tend to focus more on providing greater accessibility to data and sharing insights directly with employees in the form of nudges, individual reports and dashboards, and notifications.

Figure 13: Details of X Axis—People Analytics Technology Market Solution Matrix | RedThread Research, 2022.

Understanding the Y-axis

On the Y-axis, we classify solutions as follows—from whether vendors collect (via any method) and “create” the data themselves, as shown at the bottom of the graphic, to whether they integrate the data from other sources (e.g., government data, other third-party solutions, or other internal technologies), shown at the top of the graphic. Note that almost every vendor in our study pulls data from the HR information system (HRIS) for basic demographics, hierarchy, location, and other facts, so we don’t “count” integration with HRIS as one of the integrations on this axis.

Figure 14 indicates how the scale changes. At the bottom of the model, we have solutions that “create” data primarily by collecting it directly from employees (i.e., engagement, onboarding, or exit surveys, etc.). Moving up the axis, we add in solutions that collect data as well as integrate other data they capture on employees, such as wellbeing or performance management data, via their own tools. Moving up further (closer to the X-axis), we have solutions that still capture data but also integrate a wide range of data sources (e.g., 360-feedback data, financial / business outcome data, work productivity data like email or Slack / Microsoft Teams, and customer experience data).

Figure 14: Details of Y Axis—People Analytics Technology Market Solution Matrix | RedThread Research, 2022.

Finally, toward the top third of the Y-axis, we have solutions that primarily integrate data from others. Unlike those on the bottom, the majority of these solutions don’t offer the capability to collect data. A number of them work in tandem with those lower down on the matrix as part of the bigger people analytics technology ecosystem.

Figure 15: People Analytics Tech Market Solution Matrix | Source: RedThread Research, 2022.

When we put all of this together, we end up with 4 different quadrants with distinct characteristics.

  • Accumulated Vendors in this quadrant rank high in their ability to provide users with a longitudinal view of data, with insights that enable strategic talent decisions. Data tend to be aggregated and integrated from several sources, including external data. The insights from these vendors can be used by teams on a frequent basis to track specific areas of interest.
  • Snapshot Vendors in this quadrant are data collectors and provide insights that are reviewed for strategic talent decisions on an event-driven basis. These vendors are primarily focused on active data collection, though they may also have some newly introduced data integration capabilities.
  • Targeted This quadrant includes vendors that focus on a specific talent area (e.g., engagement /experience, performance management, wellness). They collect data directly from employees, which enables both quicker deployment and adoption, and access to insights and analysis by multiple teams on a very frequent or continuous basis. Several of them push insights directly to employees to promote faster action.
  • Guiding analytics. This quadrant includes vendors that integrate data from several different sources and are used very frequently to continuously. The combination of elements means that users can frequently access deep and broad information which can guide strategic organizational decisions, operational decisions, and individuals’ decisions about themselves or their Our mental model for solutions in this section is like a guided missile—they can give insights that can change the trajectory quickly.

It’s important to note that none of these quadrants is superior to the others. In fact, there’s likely a place for all of them in an organization’s people analytics technology ecosystem. However, by putting technologies into these boxes, we can start to think about what that ecosystem might look like and how organizations might begin to build them.

Appendix 2: Vendor demographics

This year, a total of 43 solutions participated in our study. We included publicly available information for an additional 15 vendors, bringing the total to 58. The demographic breakdown of survey participants by year founded, number of employees, and HQ location is shown in Figures 16-18.

Figure 16: Founding Years for Vendors, 1948-2020 | RedThread Research, 2022.


Figure 17: Vendor HQ Locations, 2022 | RedThread Research, 2022.


Figure 18: Number of Employees for Vendors, 2022 | RedThread Research, 2022.

Appendix 3: Customer demographics

We received a total of 128 customer responses. Figures 19-21 show the demographic breakdown for customer respondents by industry, roles, and number of employees.

Figure 19: Customer Respondent Industries, 2022* | RedThread Research, 2022.


Figure 20: Role / Job Functions of Customer Respondents, 2022 | RedThread Research, 2022.


Figure 21: Number of Employees for Customers, 2022 | RedThread Research, 2022.


People Analytics Tech: Supporting a Hybrid Work World (Presentation Slides)

Posted on Thursday, April 28th, 2022 at 5:51 PM    

What does the current people analytics tech market look like? How has it changed over the past year? What are the different capabilities offered by the vendors, and what challenges are they able to address? In this session, Stacia Garr and Priyanka Mehrotra answer these questions and many more.

This session explores:

  • An overview of the people analytics tech market
  • The changes in the market over the past year
  • People analytics vendor capabilities and strengths
  • Challenges addressed by vendors.

Learning outcomes:

  • A clear understanding of the people analytics tech landscape
  • Knowledge about the different vendors in the market and their capabilities and strengths
  • Learn how you can leverage people analytics tech to address your organizational challenges


People Analytics Tech 2020

Posted on Friday, June 18th, 2021 at 4:49 PM    

In 2020, due to the COVID-19 pandemic and the social justice movements, people analytics had an unexpected opportunity to shine. Technology played a more important role than before as people analytics team looked for ways to scale and provide deeper insights to leaders on their workforce, the majority of whom were working remotely. Our goal is to help people analytics leaders succeed in that endeavor and prepare for 2021.

Through this research, we wanted to understand:

  • How did the people analytics tech vendor market change in 2020?
  • What are the newest capabilities leaders need to know about?
  • What should leaders be thinking about when making (or expanding) a people analytics tech investment?

This study is a culmination of nearly a year of qualitative and quantitative research, that included an online poll, a vendor survey, a customer poll, and over 40 vendor briefings and demos. This flipbook highlights the changes and trends from this year, the different capabilities offered by the vendors, and the questions potential technology buyers should consider before making or expanding their tech investments. We also suggest readers check our interactive, evergreen people analytics tech tool, for current vendor information.


Using Organizational Network Analysis Today & Tomorrow: Insights from the Literature

Posted on Tuesday, June 15th, 2021 at 10:28 AM    

Introduction

If we had to choose one analytics approach that makes us most excited, then it would be organizational network analysis (ONA). Why? Because ONA:

  • Can be used for a wide variety of important use cases (hello, inclusion analytics!)
  • Is getting easier to use (thank you, vendors!)
  • Can drive big impact (for instance, an org that experienced a productivity dip following the onset of the COVID-19 pandemic, analyzed collaboration data to understand and improve it by 28%)1

The use of ONA is on the rise. A LinkedIn survey conducted in 2019 revealed that 14% of companies used ONA, with 27% of them planning to use it in the future.2 In 2020, another study revealed that 44% of companies were using ONA globally.3 Thought leaders have noticed a proliferation and increase in discussions around the value of ONA for orgs over the course of the last year.4

Additionally, we also saw a rise in the number of:

  • ONA vendors that participated in our 2020 People Analytics Tech study, as compared with 20195
  • Partnerships between ONA tech providers and other companies that offer analytics capabilities6,7
  • People analytics leaders who told us about internal network analysis systems they had put in place to understand their existing networks

Given this growing interest in the space, we decided to dive into the literature to find out what’s new with ONA and how the past 15 months have impacted orgs’ use of it.

What is ONA?

Before we dive into our lit review on this topic, let’s briefly discuss what ONA is.

Definition: Organizational network analysis (ONA) is a method to measure and graph patterns of collaboration by examining the strength, frequency, and nature of interactions between people in networks within and across orgs.8

Applied correctly and intentionally, ONA can be an extremely valuable tool in the people analytics leader’s toolkit. From identifying who are key influencers and connectors within the org to measuring connections, relationships, and inclusion—ONA can help orgs understand and, thus, strengthen their internal and external structures. The ability to do this became especially crucial during the shift to remote work when the pandemic hit.

Using ONA to understand existing networks, communication patterns, and work behaviors helped orgs prioritize, build effective strategies to address new challenges, and remove barriers for their people during the pandemic.

We looked at recent literature to understand how ONA helped orgs during the pandemic, the role it played, and how orgs should continue using it moving forward. A few key insights stood out for us from the lit:

  • ONA is instrumental in helping orgs manage remote work
  • Orgs should consider using ONA to better understand inclusion
  • ONA can help orgs design for the future

What Is New in the World OF ONA?

ONA is instrumental in helping orgs manage remote work

We’re delighted to see several articles, by both organizational leaders and solution providers, that emphasize the role ONA has played in helping orgs manage a remote workforce. In particular, two use cases stand out:

  1. Employee wellbeing and burnout. The COVID-19 pandemic has impacted life worldwide. Physical distancing and remote working led to a heightened focus on physical, mental, and emotional wellbeing for individuals.
    • Orgs want to find out which employees might be at risk of burnout. Network data are able to identify remote teams or individuals who might be at risk of isolation. Orgs are able to use those data to put policies in place at the right time and address challenges that can help.
    • Another way ONA is able to help orgs with employee wellbeing is by monitoring collaborative workload among individuals working extra hours or being tapped by their colleagues for additional work requests.9 This especially has become crucial during the shift to remote work as many individuals found it difficult to disconnect from work.10
  1. Changes in networks and connections. ONA can help orgs measure the changes in workplace networks by collecting active (e.g., surveys) and / or passive (e.g., emails, Slack, Teams) data from employees.

By identifying teams and functions in which interactions might be declining, leaders are better prepared to foster cross-team collaboration and information flow.

  • Once employees began working remotely, a major concern for orgs was to ensure that collaboration and connections were not disrupted. Orgs need employees to feel connected even while they’re not working from the office. Findings from a recently released Microsoft 2021 Work Trend study found that companies have increasingly become siloed since the switch to remote work and existing employee networks have shrunk.11
  • Other research showed that bonding connections—the closest connections that people have in their networks, and which have a positive impact on productivity—have increased during remote work. On the other hand, bridging connections—interactions beyond the team and which have a positive impact on innovation—have.12

These findings have important implications for orgs: While orgs may be moving fast with highly productive teams, they’re less able to foster new and novel ideas, and scale them through the org.

Orgs should consider using ONA to better understand inclusion

Another exciting development we’ve come across is the growing use of ONA to understand and advance inclusion. Orgs have traditionally leaned on employee perception data to understand the levels of inclusion among employees, but haven’t been successful in capturing it holistically.

The social justice movements of 2020—that resulted in a greater focus around diversity, equity, inclusion, and belonging (DEIB)—spotlighted the role that ONA can play in helping orgs understand and improve DEIB.

The ability to understand and measure inclusion at the individual and enterprise levels has become especially crucial during remote work as orgs worry about declining social connections that could result in loss in terms of performance and job satisfaction.13

Specifically, we came across several articles that spoke about how ONA can help identify:

  • Well-connected individuals to facilitate onboarding and buddy programs—to retain new employees from diverse backgrounds and help them feel included early
  • Where to place interventions for isolated groups or individuals who don’t feel included or part of the broader org—to improve cross-functional interactions and help facilitate different teams to build networks
  • Groups or teams dominated by one particular gender, race, ethnicity—to design strategies to make them more inclusive for the underrepresented groups
  • Diverse talent who are “hidden stars”—to recognize potential good candidates for leadership development and HiPo programs

As conversations and actions around DEIB have changed over the course of 2020, point-in-time surveys—such as annual engagement or pulse surveys—have yielded limitations in measuring employees’ levels of inclusion and belonging.

As the recent literature has demonstrated, an added layer of passive data—that shows how employees interact with each other and who they interact with on a regular basis—can show the social connections between them and illuminate levels of inclusion within a workplace.

ONA can help orgs design for the future

The lit review highlighted 2 key uses for ONA that can help orgs better prepare for whatever may come next:

  • Work models
  • Agile transformation

Work Models

Most CEOs expect some sort of a hybrid work model in a post-COVID-19 world. Yet, a majority of them aren’t prepared / don’t have a vision in place for it.14

Network analysis can help orgs be proactive in planning for hybrid work, rather than reacting to the challenges that arise due to the changes brought on by it.

Based on data from work behaviors, job needs, and networks, ONA can help leaders:

  1. Identify different work needs for groups or individuals, using data to make decisions on:
  • Who should return to the office
  • How frequently they should be allowed to work from home
  • What a hybrid work model should look like
  1. Be better prepared and stay connected with employees as the new working model is introduced, and put in place strategies and policies to support them
  2. Identify changing patterns in collaboration and networks for groups or individuals who move back to the office, as compared with those who continue to work from home primarily, and make the necessary course corrections if needed

Agile Transformation

The lit also highlighted the role ONA can play in helping orgs with agile transformation. The pandemic has made orgs recognize the necessity to focus on becoming more agile—if they want to survive future crises. ONA can help with that.

A crucial requirement for agile transformation is having the right people and teams in place.15 Implementing agile initiatives often involve creating networks of well-connected and empowered teams. ONA can help leaders:

  • Understand and improve how people collaborate
  • Design robust teams that are able to work together effectively16

WHAT CAUGHT OUR ATTENTION

Of the lit we reviewed, several pieces stood out to us. Each of these pieces contains information we found useful and / or intriguing. We learned from their authors’ perspectives—and encourage you to do the same.

Hybrid working may change our workplace social networks. What does it mean for inclusion?

Paris Will, LSE Blog, March 2021

Looks at what social network analysis reveals about the changes brought about by hybrid working and their potential for affecting inclusion in the workplace. The author finds that there may be both positive impacts, such as stronger ties and greater involvement in workplace processes, along with the risks of reduced social information-sharing.

At the organizational level, the connectivity of the network can be assessed to see how many people are involved in different workplace processes, and at the individual level, it can show how included one is by the amount of social connections they have.

Highlights

  • Benefits and risks may come along as a result of shifting to a hybrid working model in the post-COVID-19 world, such as flexible working along with reduced opportunities for informal contact
  • Social network analysis can play an important role in illuminating levels of inclusion in a workplace
  • For orgs looking to transition to a hybrid work model, now is a good opportunity for them to monitor and assess the structural social components underlying inclusion within their workplace

What is the impact of virtual and hybrid working on innovation? (Interview with Michael Arena)

David Green, myHRfuture, December 2020

An interview with Michael Arena, VP for Talent and Development at Amazon Web Services, about the role of social capital, and how orgs can measure and harness it to their advantage through ONA.

I describe human capital as sort of a summarization of what you and I know, our experiences, our competencies, our capabilities, social capital is basically how well positioned we are inside of our organizations to leverage that human capital.

Highlights

  • ONA can be used to measure social capital: 2 primary types of social capital are bonding and bridging
  • Passive ONA is good to study the dynamic effects of a network across time because a network is never static
  • HR often tends to be responsive and ONA can help HR become proactive in helping orgs prepare for the future

To weather a crisis, build a network of teams

Andrea Alexander, Aaron De Smet, Sarah Kleinman, and Marino Mugayar-Baldocchi, McKinsey, April 2020

Details 4 steps that can help orgs create a dynamic and collaborative team structure which can tackle an org’s most pressing problems quickly.

A robust network of empowered teams makes faster, better decisions. It is united by a common purpose, that gathers information, devises solutions, puts them into practice, and refines outcomes.

Highlights

  • Create teams that’ll tackle current strategic priorities and key challenges facing the org
  • After creating the initial set of teams, a leader must shift toward ensuring that multidirectional communication is taking place—not only across teams within the network, but also between these teams and the rest of the org
  • The leader’s approach to communication will foster an environment of collaboration, transparency, and psychological safety that is crucial to its success
  • Once the initial network of teams is established and after support from leadership early in the journey, the network should become self-sustaining and self-managing

The age of behavioral analytics at work: using IT metadata to make improved business decisions

Philip Arkcoll, IHRIM, 2020

Makes the case for using ONA to responsibly and ethically analyze communication and collaboration data, and gather insights to help orgs make better business decisions and improve employee experience.

In most organizations, thousands of these small interactions or sessions occur across a variety of these digital platforms in a given work day. As a result, within each of these digital tools lies a mountain of information on how organization functions, how work gets done and what the day-to-day experience of employees is like.

Highlights

  • ONA has grown significantly in popularity over the last few years
  • Finding an ethical way to perform ONA isn’t just important for employee buy-in, but also may be a matter of regulatory compliance as the laws on data continue to evolve
  • A leading practice is to avoid visual interpretation of network diagrams, and focus more on network metrics and mathematical models to look at parameters of the network and included groups
  • To get to the valuable insights, an org needs to go beyond just looking at the raw data and metrics on interaction

Using adaptable organization network analysis to reveal patterns that drive inclusion

Maya Bodan, India Mullady, and Devon Dickau, Deloitte Blog, April 2020

Highlights the role of ONA in helping orgs identify if their leaders, teams, or functions are not only diverse, but also inclusive. The article details the use of ONA to illuminate otherwise invisible information flows, connectivity, and collaboration between individuals and groups.

Next to increasingly standard inclusion measures such as engagement survey results that reveal workforce assessment and quantitative assessments of the talent life cycle, uncovering potential organizational biases, AONA can give leaders relationship-based analytic insights on how work is truly getting done in their organization, shining a light on who is being included—and who is not.

Highlights

  • ONA can help surface individuals who serve as liaisons, groups that operate in a vacuum, and employees who foster or hinder information flow
  • ONA can help leaders focus more on underrepresented minority groups and highlight any systemic discrepancies
  • Some example questions that ONA can help answer include:
    • Where do we start the conversation on inclusivity in our org?
    • Are our informal mentorship efforts and programs effective?

People Analytics Tech 2020 Overview

Posted on Thursday, December 3rd, 2020 at 4:07 PM    

When we published our 2019 People Analytics Tech (PAT) study at the very end of last year, we thought we had a strong sense of what was coming in the next year. Like everyone else, we were wrong.

COVID-19 and the social justice movements of 2020 dramatically changed all of our lives. As a result, business leaders wanted to understand what was happening with their people on a much deeper level. People analytics teams and their technology had an unexpected opportunity to shine.

Some teams and technologies seized that opportunity. Those who fared the best had already invested in regular employee listening strategies, democratized data analytics products for the broader organization, and created a flexible and integrated tech stack.

Other teams had to perform heroic acts to get leaders the information they needed. As the crisis of the moment turned into the reality of the year, they began to explore new approaches to deliver people insights at scale.

All of this brings us to now, when many people analytics leaders are looking to 2021, beginning to contemplate new investments, but have less time than ever to think about it.

That’s where our new research on people analytics tech comes in. Our goal is to help people analytics leaders – whether you are in the more prepared group or the heroic acts camp – prepare for next year. Specifically, we focus on 3 questions:

  • How did the people analytics tech vendor market change in 2020?
  • What are the newest capabilities you need to know about?
  • What should you be thinking about when making (or expanding) a people analytics tech investment?

Study overview

This study has the same overall goal as our 2019 study: To make the people analytics technology market more understandable for people analytics practitioners (PAPs) as well as vendors.

Our overall methodology is similar to last year (see Figure 1). We administered a robust vendor survey (June–August) and conducted 60-90-minute vendor briefings (July–November). We made a few additions this year, too:

  • We added a customer poll, so we could better understand people analytics leaders’ perspectives on their vendors’ offerings—this included a customer Net Promoter Score® (NPS)
  • We asked each vendor for an opportunity to see their sandbox environment, so we could get a better sense of their product

Methodology of PAT study

Figure 1: Methodology for 2020 PAT study | Source: RedThread Research, 2020.

We also created a robust evergreen tool, which serves as the repository of vendor-specific information (a lot more information on this below!). This new tool includes an updated RedThread assessment on every vendor, customer NPS and other customer insights (when there were enough responses), screenshots, and case studies. That allows this report just to focus on the overall market.

Key findings

The study is broken into three areas: market changes, vendor capabilities, and considerations for making (or expanding) PAT investments. That said, the overall top five findings are below:

  1. The people analytics tech market responded to customers’ 2020 needs. The events of 2020 required companies to foster connectedness and keep their employees engaged, secure, and safe. The majority of solutions in our study reported employee engagement, experience, and diversity, equity, inclusion, and belonging (DEIB) as their primary areas of focus this year.
  2. Practitioners have more choices of technology than ever. We identified 121 people analytics technologies (PAT) on the market today. The market overall is growing quickly, with a 35% growth rate between 2019 and 2020, and a 55% CAGR for the last four years. We estimate the overall market value at $2 billion.
  3. People analytics practitioners and HR teams are the key users today. This year, 96% of vendors said people analytics practitioners (PAPs) are their primary audience, compared to 77% last year. HR business partners (HRBPs) were the next critical audience, cited as primary by 70% of vendors. Most solutions offer targeted insights and resources to help these two audiences use their solution effectively. However, the majority of vendors anticipate that HRBPs and people managers will be using their solutions more frequently in the next 3 years.
  4. Many solutions are not as easy to use or user-friendly as vendors believe them to be. For customers, ease of use and simplicity is a big differentiator. Given the high number of vendors who claim this is a differentiator – and the number of customers who claim they are still seeking it – we don’t think that most vendors actually differentiate on this capability.
  5. New capabilities include advanced NLP, deep machine learning, and the use of new, unstructured data. Some of the most interesting new capabilities include context-configurable natural language processing (NLP), use of deep machine learning to analyze unstructured data (e.g., voice, images, video), and the collection of that unstructured data.

The People Analytics Tech Market Solution Matrix

In this research, we attempt to provide a foundational understanding of the market and where the different vendors fit within it. To do this, like last year, we mapped all of the vendors in the study on our People Analytics Tech Market Solution Matrix (see Figure 9). We also call it our 2×2 matrix. But please remember, unlike some other analysts’ 2x2s, up and to the right is NOT better. The different boxes all have their own strengths.

To understand the market, we compare two aspects of vendors’ capabilities: usage frequency and data sources. This approach allows us to clarify if, on the X-axis, the analysis is primarily used for strategic organizational decisions (frequent analysis) or informing individuals about themselves / their teams (continuous analysis). It also helps us see, on the Y-axis, the number of data sources integrated, which can give us a sense of the integration complexity. You can see here for more details on the different axes and how we categorize vendors.

When we compare last year’s and this year’s studies, we notice a few things:

  • Compressing toward the X-axis. More vendors than before are both creating and integrating data––meaning we have more vendors in the center of the matrix
  • Moving to the right on the X-axis. More vendors are making data continuously available and increasingly accessible to more user types (e.g., business leaders / C-suite, people managers, and employees)––meaning more vendors moved to the right side of our matrix this year
  • Fragmenting of vendor categories. Last year, we were able to reasonably and clearly group vendor categories (e.g., employee engagement / experience or workforce planning platforms) by their location on the matrix; this year, given some of the shifts mentioned above, we find them somewhat more fragmented––meaning there’s more differentiation between the vendors within a given category

Figure 2: People Analytics Tech Market Solution Matrix | Source: RedThread Research, 2020.

Check out the full study and tool

The full study has lots more information than what we’ve detailed here, including customer quotes, overall customer NPS scores, and checklists for both vendors and people analytics practitioners to get started.

As you may know, we recently launched our paid membership, and the full study is available only to study participants and paid members. You can also access the study on the websites of PAFOW and Insight222, as they were generous enough to sponsor this research.

In addition, we encourage you to check out the brand new, fully redesigned People Analytics Tech tool, which is available both to members and non-members (the tool will also be available on the websites of PAFOW and Insight222). You can filter on a wide range of factors, such as analysis type, capabilities, customer NPS©, customer size served, primary talent area of focus, top 3 industries served, and primary users (see Figure 3).


Figure 3: PAT Tool, Example of Filtering Capabilities | Source: RedThread Research, 2020.

Once you click on a vendor, you will be taken to an overview tab, which provides our RedThread assessment, vendor details, and customer feedback (see Figure X). Members can also access additional insights, screenshots, and case studies.

Figure 4: PAT Tool, Example of Overview Page | Source: RedThread Research, 2020.

This tool is designed to be evergreen, so it will be updated continuously as we conduct briefings throughout the year.

A Thank You

This study is a labor of love, in that it reflects a significant time investment from everyone who participated in its development. We want to thank all of the vendors and customers who gave their time, energy, and expertise to make this such a robust study and tool.

If you have any questions about this research or about becoming a RedThread member, please contact us at [email protected].

People Analytics Tech: The Vendors, RedThread Research / Stacia Garr and Priyanka Mehrotra, 2019. https://redthreadresearch.com/pat-thevendors/ and People Analytics Tech: The Market, RedThread Research / Stacia Garr and Priyanka Mehrotra, 2019. https://redthreadresearch.com/pat-themarket/


People Analytics Tech 2020

Posted on Wednesday, December 2nd, 2020 at 4:53 PM    

In 2020, due to the COVID-19 pandemic and the social justice movements, people analytics had an unexpected opportunity to shine. Technology played a more important role than before as people analytics team looked for ways to scale and provide deeper insights to leaders on their workforce, the majority of whom were working remotely. Our goal is to help people analytics leaders succeed in that endeavor and prepare for 2021.

Through this research, we wanted to understand:

  • How did the people analytics tech vendor market change in 2020?
  • What are the newest capabilities leaders need to know about?
  • What should leaders be thinking about when making (or expanding) a people analytics tech investment?

This study is a culmination of nearly a year of qualitative and quantitative research, that included an online poll, a vendor survey, a customer poll, and over 40 vendor briefings and demos. This flipbook highlights the changes and trends from this year, the different capabilities offered by the vendors, and the questions potential technology buyers should consider before making or expanding their tech investments. We also suggest readers check our interactive, evergreen people analytics tech tool, for current vendor information.


The “Now” of Work & People Analytics: Lessons from an Octopus

Posted on Wednesday, August 12th, 2020 at 3:59 PM    

Introduction

“Unprecedented”

“Uber-volatile”

“Super-complex”

These are just some of the words we’ve heard used to describe the events of 2020. As a result, all parts of organizations – including people analytics (PA) – have worked on overdrive to help leaders respond to this new work environment.

The challenge: Most organizations weren’t built for this amount of volatility and change, and so are struggling to manage it effectively. Existing hierarchical structures were designed for relative levels of stability. They impose information, decision-making, and control protocols that maintain maximum efficiency and limit local autonomy. While there’s certainly value in some centralization, in too big doses it hampers organizations’ abilities to move quickly and in localized ways – which is what they’ve had to do in responding to the current business environment.

To be clear, for years we’ve all been moving toward a “future of work” that was projected to be volatile, uncertain, complex, and ambiguous (VUCA), and which would require organizations to be more agile and responsive.

The COVID-19 pandemic put us all in a time machine and changed “the future of work” to “the now of work.”

This future has arrived – and organizations need a different operating model to function effectively in this new work environment.

Proposed new operating model: The octopus

When people have needs that are completely different from before, we often look to other models and approaches for clues about how to respond. Many turn to nature for inspiration, in what is known as biomimicry.1 For example, when engineers tried to design faster trains, they looked to Kingfisher birds for ideas; or when (other) engineers attempted to create better ventilation in buildings, they used termite mounds as a model.2 In this vein, we’d like to turn to the (not so humble) octopus as inspiration for a new approach to managing the “now of work.”

Yes, you read that right – an octopus.3

We were recently surprised to learn that an octopus actually has 9 brains – a central brain to control the nervous system and a small brain in each of its 8 arms.4 This enables each of the 8 arms to work independently of the others in responding to its environment. Because of this (not in spite of it), an octopus is more aware of both disruptions and opportunities, and is thereby better able to respond to them.

In many ways, an octopus is an apt metaphor for the type of organization we need right now, one that has many brains which are distributed throughout the organization instead of holding them centrally. These smaller brains enable the many arms of the organization to act independently and respond faster and more effectively to its environment, while the central brain ensures that the smaller brains all work together toward a larger goal (see example of how this works in Figure 1).

Figure 1: How Octopus Arms Can Make Independent Decisions Without Input from Its Central Brain | Source: Science Alert, 2019.

So what does an octopus have to do with an organization that can operate in “the now of work?” Similar to the octopus, organizations that can respond to the current environment use many sensors to get multiple points of view (aka: data) about the environment, and then use that information to help them determine trends. Likewise, octopus-like organizations can respond as necessary to specific parts of the business environment – and respond differently, depending on need.

We call this “responsivity,” which we define as follows:

Responsivity is the ability of organizations to recognize trends in the operating environment and effectively turn possible disruptions from those trends into a distinct organizational advantage.5

To better understand responsivity, we reviewed more than 100 articles on topics related to organizational responsiveness and created a comprehensive 90-item survey on the topic, which 373 HR and business leaders completed. In the course of our analysis, we created a Responsivity Index, which includes 7 questions designed to measure responsivity, such as the extent to which the organization openly shares information and is decentralized in structure.

We supplemented our analysis of these data with interviews with almost 30 leaders and a roundtable series that included more than 100 leaders­­.6 We also completed an additional set of interviews with approximately 20 people analytics practitioners, focusing on topics like “the future of work” and “people analytics’ role in enabling the organization of the future.” We did all of this to understand what responsivity is, what affects it, what separates organizations in the bottom quartile of the Responsivity Index (low responsivity) from those in the top quartile (high responsivity), if it matters to business outcomes, and how to create it.7

Why orgs should embrace high responsivity

One of the most important questions to ask is:

Does being a high-responsivity organization (in the top quartile of the index) matter?

We know people think responsivity matters. For example, when we asked people analytics practitioners what an “organization of the future” should look like, we heard the following:

“An organization of the future is more biological and emergent than static and structured. It will have structure but will also have decoupled local cells that can respond and act with speed.”

Michael Arena, VP of talent & development, Amazon Web Services

“It will be highly fluid, able to adapt to each and every context it is facing by business / country – none of this ‘one-model-fits-all.’ It must also be highly resilient, have a clear purpose, effectively leverage tech and data, and embrace the gig economy.”

Alexis Saussinan, global head of strategic workforce planning & people analytics, Merck KGaA

“Organizations that can be agile, who can assess risk effectively, and who can make decisions quickly can adapt quicker to the needs of the future.”

Chief data officer HR & global head of people analytics, finance industry

But does it actually matter, from a business-results perspective?

As it turns out, it does. We found that among organizations in the top quartile of our Responsivity Index, 95% of them meet or exceed their business goals, compared with just 21% of organizations in the bottom quartile. Similarly, organizations that scored high on our Responsivity Index report responding quickly to market changes, innovating faster than the competition, having satisfied customers, and encouraging higher levels of engagement among their employees (see Figure 2).

Figure 2: Business Outcomes of Organizations, High Responsivity vs. Low Responsivity | Source: RedThread Research, 2020.

The 4 lenses of high responsivity

Given this, how does an organization become more responsive?

Our research shows that to create a responsive, octopus-like organization, leaders should use 4 lenses when implementing people practices, processes, and technology.

These 4 lenses (see Figure 3), respect, distributed authority, growth and transparency, and trust, are enablers – things that if effectively integrated – enhance other people practices. They are not fundamentally new practices.

Figure 3: A Model for Responsivity | Source: RedThread Research, 2020.

We use the term “lenses” very intentionally: Lenses are transparent, but generally change how things look. Also, all of the lenses are of equal importance. They can be used all at the same time or in different orders to develop and enhance existing practices. That said, while some of the lenses may seem similar (you might be asking yourself, “What’s the difference between respect and trust, anyway?”), our analysis and interviews reveal that each of the lenses is distinct. For example, respect is more about if people feel heard, whereas trust is more about if people feel connected to each other. Organizations may have one without the other – but it’s the combination of all the lenses that’s most powerful.

Enter people analytics

While the role of people analytics may not be immediately apparent, our analysis found people data and technology to be critical to creating a responsive organization.

In short, people analytics can provide targeted, localized insights and channel that information to the relevant parts of the organization. It can also, through the types of information that are measured and how those are conveyed, influence the conversations that enable responsivity.

But how, exactly, should people analytics do that? What are the practices PA practitioners can use to enable this responsive organization? This article is our exploration of the role of people analytics in creating responsive organizations – effectively supporting the “now of work.”

People analytics’ role in building responsive orgs

In our interviews with PA practitioners, we asked how they envisioned their role in creating an organization prepared to respond to the needs of “the future of work.” (We started asking this question before COVID-19, changing it to “the future that is now” as the pandemic unfolded.) The quote below is representative of what we heard:

“You have to enable, for the organization, a focus on innovation and agility. You have to provide information and insights that are easy to consume and enable the organization to make business decisions quickly.”

Dawn Klinghoffer, people analytics lead, Microsoft

The challenge always comes, though, in how to actually do this. While a business-aligned approach is critical, it’s not enough to enable responsivity. This is where the 4 lenses come in.

Lens 1: Respect

While we mentioned earlier that there isn’t necessarily a “right” order for the lenses, we do know that respect is foundational to responsivity. Employees should feel respected for their abilities, knowledge, skills, and ideas.

In our study, some of the significant items for respect include gathering “bottoms-up” information, having autonomy and respect from managers, and providing psychological safety.8

A foundation of respect often means taking a step back from some of the Tayloresque9 systems, processes, and policies that organizations put into place to ensure efficiency and “sameness.” For respect, organizations need to shift their focus to the differences:

  • The individuality of employees
  • Individuals’ skills, knowledge, and capabilities
  • How individuals combine in different ways to create impact

This is an opportunity for people analytics to shine, given its ability to provide highly individualized insights.

PA’s role in building respect

Given that people analytics practitioners are not directly in the room with employees, it may seem difficult for them to influence respect. This, however, is hardly the case. Some of the most robust examples of how PA can help enable respect include the following:

  • Collecting and analyzing data on employees’ perspectives, needs, and changes – Including specifically understanding their unique current reality, focusing on topics such as psychological safety, barriers to doing work effectively, access to resources, etc.
  • Keeping the “people” in people data – Looking for stories and qualitative data that brings the quantitative data to life, and remembering that people data represents individual people

Figure 4: PA’s Role in Building Respect | Source: RedThread Research, 2020.

Keeping our octopus metaphor in mind, these practices together build greater responsivity because, for individuals, they create environments in which they can share what they’re seeing and feeling. For organizations, these practices enable leaders to effectively collect and digest this information, while staying in touch with the very human aspect of their data. Speaking to the bulleted points above, one of our interviewees stated:

“A strategy for ‘continuous listening’ to gather employees’ perspectives is important in all times, but in our current COVID-19 moment, it’s truly critical. We should be deploying questions to employees on a weekly basis, starting with the basics such as, ‘Do you feel safe? Do you have what you need? What would help you to remain productive?’ What you ask about communicates what you care about. People analytics teams should be driving this.”

Nicholas Garbis, VP of people analytics strategy, One Model, Inc. (former leader of workforce planning, Allianz & General Electric)

During our interviews, a financial services firm shared how its PA team uses its employee experience survey to understand employees’ perspectives and the challenges preventing them from doing their work successfully. The team analyzes open-ended questions on what employees think about the company, the environment in which they work, and what can be improved. It shares the results by using powerful visuals that depict the different topics discussed, including compliments and complaints, which could be further analyzed by business level. Leaders have been very enthusiastic about this new information, as it provides understanding of employee voice quickly and easily, and allows them to initiate targeted actions.

Remembering the human aspect of people data is also essential in building and enabling respect. One PA leader told us about his organization’s efforts to keep its analysis “human” and achieve a greater contextual understanding of the data by finding the outliers – and putting names and stories with those cases – to better understand the recommendations they should make.

Another PA leader said it eloquently:

“We all need to remember that this is people data: What people think, feel, how they are paid. Our analysis affects their lives and jobs. Someone in your data set had a bad day, someone didn’t show up well, someone had something happen. We’re not dealing in shades of blue to drive click-through rates. We’re not counting widgets. We have to impress that on anyone who wants you to do any people analytics work – we are the stewards of that respect line.”

Head of global talent analytics & research, multinational technology company

Respect during crises

During the COVID-19 crisis, one of most effective ways PA functions have shown respect for their employees is by tuning and adjusting their listening channels and strategy to capture the changing needs, experiences, and impacts of their employees.

For example, Colt Technology Services, a provider of high bandwidth services, was faced with the challenge of keeping its newly remote managers and employees engaged and motivated as they responded to a surge in their network traffic. In the past, the company’s listening strategy had relied on an annual employee survey, pulse surveys to capture real-time employee feedback, and surveys supporting strategic initiatives.

Due to uncertainty and stress brought on by the COVID-19 crisis, the company realized it needed to fine-tune and refocus its listening strategy to quickly uncover and address employee concerns. Colt Technology implemented a range of informal and formal listening activities along with the opportunity for employees to post anonymous questions. The active listening helped leadership understand what was important to employees during the crisis. The company implemented a number of important policies, including providing financial support to help employees set up a home office and making the commitment to pay a substantial proportion of sick pay if an employee happened to contract the virus.10

Another approach was used by Nestlé, when it turned to an active internal crowdsourcing platform (previously used to solve supply-chain issues) to identify ideas for enhancing health and safety across its sites during COVID-19. As the company’s head of employee innovation remarked:

“The impact of crowdsourcing ideas is phenomenal. What started with a bottom up open innovation process for IT to solve supply chain issues 6 years ago has grown to accelerate business innovation in areas such as new products, services, sustainable packaging, manufacturing, agriculture and, of course, in holistically navigating COVID-19.”11

We’d like to hear what you think – what additional ideas do you have on how people analytics can enable respect? Please enter them below and we’ll update this article with relevant additions once we’ve received enough.

Lens 2: Distributed authority

Responsive organizations distribute authority throughout the organization – broadly and deeply – within their ranks and empower all levels of the organization to act. Similar to the video of the octopus, distributed authority allows, within reason, each of the “arms” of the organization to make decisions and operate without explicit approval or guidance from the centralized “brain.” Organizations with high responsivity rely on guiding principles, quality data and insights, and employees’ understanding and capabilities to speed up decision-making and action.

The specific items for distributed authority from our survey are broad decision-making rights, diverse and engaged teams, and broad collaboration.12

It’s important to note that, while clarity around what decision-making rights employees have is central to high responsivity, it’s not enough. Organizations need to, at the same time, ensure that employees feel empowered and have the support they need to use those rights and make decisions. This is where access to data, insights, networks, and collaboration come in. By providing access to these resources, which are needed for decision-making and enabling collaborative behaviors, organizations can enable higher-quality and more inclusive decision-making.

PA’s role in distributed authority

If we go back to our metaphor of the octopus, with PA serving as the sensors, the absolutely critical role of people analytics in distributed authority becomes abundantly clear.

Without high-quality data and insights, it’s extraordinarily difficult for local teams to understand their specific situations quickly enough to make the appropriate decisions and act on them.

As one interviewee put it,

“We have to empower people throughout the organization with data. They need powerful business intelligence dashboards with no latency, so they can start slicing and dicing immediately. People analytics should be enabling this.”

Dawn Klinghoffer, people analytics lead, Microsoft

Some of the ways we’ve seen PA support distributed authority include:

  • Designing analytics products accessible to a broad set of users – Making data and insights widely available to all employees, including diverse employees who may not have access to the networks that typically have critical information
  • Sharing insights that are valuable to employees and managers – Ensuring that the data provided to different users is relevant to their specific decisions and avoiding providing information that is merely interesting
  • Analyzing and enabling collaboration – Providing resources that enable employees to collaborate more effectively and broadly, and thus make better decisions

Figure 5: PA’s Role in Distributed Authority | Source: RedThread Research, 2020.

The first bulleted point above highlights the need to address the underlying assumptions many organizations have that data and decision-making should be limited to a group of senior leaders. For example, when beginning the project intake process, the PA team at ABN Amro holds discussions with leaders to understand why the topics they’re investigating are important to leadership, what the hypotheses are, and what they are going to do with the results:

“What we are trying to do is drive action. During the intake phase, we ask: Are our insights going to be used, or will the leadership pick the two that they like and discard the rest? We are asking for commitment before we move ahead.”

Patrick Coolen, global head of people analytics, ABN Amro

Sweetgreen is an example of how an organization can share relevant insights with managers and employees. As a restaurant chain, the company needed to understand employee sentiment and enable action-taking on feedback at both the corporate level as well as among employees working as frontline staff workers at the restaurants. By leveraging a people analytics solution that could analyze data from the stores and teams, and provide customized action recommendations directly to the employees and managers, Sweetgreen was able to drive actions at the individual employee level. As a result, more than 75% of employees reported taking action because of the email recommendations received and 80% said that the “nudged” changes in behaviors have made work better.13

“If we want our organizations to be more human and more responsive, we have to empower managers more. Give them more structure and insight on how to manage people and give them a way to share how they want to be managed. Surface customized insights for managers on how they can engage their team better – and then they will do better.”

Brian Fruchey, former head of people analytics, Indeed.com

Moving on to the collaboration point, PA leaders are increasingly using organizational network analysis (ONA) to understand how collaboration is happening within organizations. General Motors (GM) is a prime example of using ONA to identify potential areas of innovation, and empowering employees and groups to take action.14 The company realized that, to stay ahead in the constantly innovating and competitive automotive industry, it needed to ensure that the best ideas and projects are moved to production. The company leveraged ONA to understand where it needed to create “adaptive spaces” that connected innovative pockets with the company’s operational functions. The then chief talent officer at GM built an organizational context which pushed new ideas and concepts from entrepreneurial pockets within the organization into production and action. This not only resulted in a greater number of ideas coming to fruition but also helped clear out noise and enabled faster decision-making.

Distributed authority during crises

One of the ways people analytics can help organizations distribute authority, empower people, and enable quick decision-making during the current crisis is by sharing data and insights that help them take actions. An example of this comes from Workday which, within a week of the pandemic hitting, doubled down on its efforts to capture employee sentiment. Once the company had the data and conducted analyses, it shared those insights directly with its people leaders and accompanied that with context-based, specifically curated actions which people leaders can take to support their teams.15

“How do we help secure and safeguard people’s wellbeing, how do we support them in a remote context, and then how do we enable and support their productivity so they can support our great customers? That’s what we measure on an ongoing basis and what we use to think about how we can help our people leaders take action.”

Greg Pryor, SVP people & performance, Workday

An example of using ONA during the current crises comes from a global healthcare provider that was looking to optimize cross-functional collaboration across its organization. The data analysis helped identify cross-functional “boundary spanners” – individuals who act as connectors across diverse teams and groups within the company. Once identified, the company decided to survey these cross-functional influencers more frequently during the current period of rapid change, to provide feedback on organizational issues and challenges from the frontlines. By mobilizing an agile network of teams that included these “boundary spanners” who often exist outside the traditional hierarchical structure, the organization was able to adopt a rapid and responsive decision-making approach, and support greater collaboration.16

Now it’s your turn – tell us how you’ve seen people analytics teams help distribute authority:

Lens 3: Transparency & growth

The events of 2020 have highlighted just how quickly markets and industries can shift – and the resulting need for organizations to change direction on a dime. This requires organizations to continuously communicate that direction to employees and clarify how it affects their day-to-day work. It also requires organizations to ensure employees have the knowledge and skills needed to execute.

While on the surface it might not be obvious how transparency and growth go together, our analysis and interviews revealed a link between the two. Employees need both a high degree of transparency into how they and the organization are doing AND broad encouragement to learn, grow, and at times fail – to enable them to act responsively on behalf of the organization. Specifically, by providing greater transparency around performance and development through data and insights and by helping employees understand the resources they have at their disposal to prepare for the future, organizations enable responsivity.

Our analysis revealed 3 specific items that are critical to transparency and growth: transparent performance, skills and growth resources, and managers and leaders as enablers.17

PA’s role in transparency & growth

People analytics has a primary role in creating greater transparency and helping understand how growth is or isn’t happening in an organization. Some of the most obvious ways PA can do this is by:

  • Supporting continuous feedback and goal alignment to increase clarity around the organization’s overall growth – Providing resources for transparent and honest feedback and reviews, and helping employees align their performance with the company’s overall goals
  • Sharing more data with managers and employees regarding their team’s health and performance – Including information on how they work and performance on goals / objectives and key results
  • Providing clarity around critical skills – Collaborating with the learning team to understand the supply and demand of future skills, and how L&D resources can enable the growth of critical skills

Figure 6: PA’s Role in Transparency & Growth | Source: RedThread Research, 2020.

An example of enabling transparency and growth through feedback and goal alignment comes from Privia Health. The company overhauled its existing performance review process which was tedious and unstructured by bringing in a people analytics solution that allowed for a more streamlined approach to employee feedback, performance check-ins, and goal alignment. By leveraging the PA solution’s capabilities, the organization was able to activate continuous feedback. For example, 86% of employees downloaded a new email plug-in to submit feedback, driving greater transparency around performance. The company also saw a 20% increase in goal setting and adoption, and an increase in the number of teams performing more frequent quarterly goal check-ins – reflecting a growing focus on development.18

Currently, a significant amount of data is captured on employees’ performance, but it’s often not integrated and made available to leaders, managers, or employees. This limitation hinders everyone’s ability to respond quickly to changes in the environment.

The analytics team at EY designed a dashboard for their global organization (155 countries) accessible by HR professionals and senior business leaders that blends data across a wide range of years, providing 120+ attributes for each employee. This dashboard presents information on critical topics like sales, profitability, and utilization data – with much of that information not previously available in such a manner (i.e., specific ratios on productivity). What makes this dashboard unique is that it combines critical data with insights about employees’ experiences, with tabs showing survey results from several employee tenure periods such as recruiting, onboarding, 90-days, 120-days, and, eventually, exit. The idea is to understand how people are thinking and feeling across their entire employee experience, and for the business to be able to see those insights in real-time.

“Our dashboards are among the simpler things we’ve built. Yet, they are one of the highest-impact products we’ve delivered, as they bring together many, many different data sets that were not previously connected and makes them available to managers and employees. This dashboard is at the core of how our business manages and understands people performance. The transparency this provides allows the business to know where it stands and where it needs to grow.”

Blair Hopkins, People Advisory Services, EY

SAP realized that one of the ways it could help its managers improve their communications with their direct reports was by collecting and sharing data on the frequency, tone, and responsiveness of their communications. The company leveraged a people analytics technology solution to analyze meta-data, and deliver personalized coaching and feedback to managers – directly to their inboxes – on the areas that they could potentially improve and recommended steps they can take. As a result, 83% of managers reported an improvement in their self-awareness of how they interact with their teams. Additionally, the company also saw a 17% increase in the level of recognition of employees’ efforts by the managers using the solution.19

Moving to the last bullet on the topic of skills, our research shows that PA’s role in identifying critical skills – and associated gaps – is becoming ever-more important. As one interviewee stated:

“We’re starting to see a much bigger focus on skills and, in particular, on identifying adjacent skills. So, if someone knows one thing, they might also know something else – or, critically, be able to learn it. This gives us a much better ability to understand our current capabilities and which skills we may be able to acquire by growing our people versus investing in new people.”

Marilyn Becker, senior director, people analytics & HR technology strategy, Western Digital

We’ve seen relatively few examples of learning and PA teams partnering on the question of the existing skills in the organization to provide greater clarity around the effectiveness of resources in growing those skills – we think this is a huge area of opportunity. Working with the learning team, PA can provide tools and support to help employees understand their skills gaps for their current responsibilities, for responsibilities they might be interested in, and for responsibilities the organization knows it will need in the future. In addition, we increasingly see PA working with learning to understand how existing learning resources are being used and the extent to which those resources are addressing skills gaps.

At ABN Amro, identifying and shrinking existing skills gaps at the organizational level, and investing in learning and skill measurement at the individual level are 2 of the 3 core pillars its HR strategy is built on. The PA team is particularly interested in looking at individual skill assessments through a learning experience tool that provides learning content to employees in a user-friendly manner, and allows the team to track and assess an individual’s skill maturity and how they’re performing.

Transparency & growth during crises

One of the biggest changes we’ve seen since the start of the COVID-19 pandemic is a focus on providing managers and employees with more insights about how they’re doing since moving to a work-from-home environment. For example, we’ve seen numerous PA vendors offer work-from-home reports for managers and individuals that provide data on:

  • Total meeting time
  • Amount of uninterrupted focus time
  • Amount of after-hours email
  • Work activity
  • Workday length
  • Manager responsiveness

Managers and employees can then use these data to talk about their new working styles, what needs to be adjusted, and the support managers can provide.

Another area of significant importance during the pandemic has been skills identification to support the redeployment of resources. Given that COVID-19 hasn’t just caused a health crisis but also an economic one, National Australia Bank (NAB) is finding that a higher-than-average number of customers (e.g., individuals, small business owners, and larger businesses) than usual are looking to the bank for assistance. To manage the higher volume of phone calls, emails, and chats, the PA team identified individuals with previous customer-facing experience – which helped the bank redeploy 700 people into customer-facing roles. This was all done within a few days of the need identification.20

“The ability to redeploy 700 people within a few days shows the importance of having good HR data in a time of crisis.”

Thomas Rasmussen, executive general manager, employee experience, digital & analytics, National Australia Bank21

Workday has used a different approach during the recent health and societal crisis. The company’s team put specific insights related to team stress and resilience and belonging and inclusion directly on every manager’s dashboard. The PA team then sent specific “nudges” to each manager, with a guide on how to have a conversation with their team’s ability to deal with emotional exhaustion and stress.

Figure 7: Personalized Employee Sentiment Available to All Managers at Workday | Source: Workday, 2020.

You know the drill – it’s now your turn. Tell us what else you’ve seen:

Lens 4: Trust

Organizations with trust don’t just respect and listen to employees – they adopt a community mindset. These organizations have ceased to think in terms of “us” (management) and “them” (employees), and instead have adopted a “we’re all in this together” attitude – one that helps employees learn from their mistakes and invests in solving problems together. Continuing our octopus metaphor, this is the ability for all “arms” to trust that each one’s doing the right thing – and that the central “brain” of the organization is doing the right thing, too.

The specific items our survey revealed as most important to building trust are how the organization handles failure, brings outside perspectives inside, and builds community.22

PA’s role in creating trust

Similar to respect, it may seem as though PA isn’t directly tied to the organization’s ability to create trust. However, we think this is a fundamental role for PA in the following ways:

  • Providing analyses and metrics that focus on activities which reinforce trust – Such as normalizing failure, and reinforcing trust in employee decision-making and information-sharing
  • Helping people understand their communities – Who is in the community, how to build them, and how to make them stronger
  • Keeping issues of data ethics, privacy, and access central to the efforts at all times – Ensuring that all data is collected and used ethically, continually updated, and communicating the value to the employees

Figure 8: PA’s Role in Creating Trust | Source: RedThread Research, 2020.

We haven’t encountered many examples of organizations thinking through what the relevant PA metrics could be for encouraging trust, but we think that many of the concepts we’ve introduced in this article could form the basis of new metrics, such as:

  • Number of “intelligent failures” – Number of times per year when employees tried something that seemed like a good idea, but ultimately didn’t work; this could be reported at individual and organizational levels
  • Breadth of decision-making rights – Frequency with which different people at different levels feel comfortable and psychologically safe to make critical decisions without approvals
  • Extent of data-based information-sharing – Frequency with which critical information is shared with different people at various levels

While not obvious on the surface, PA can play a crucial role in building communities and helping organizations foster trust among groups and teams. Workday helps its employees, or “workmates” as it calls them, understand and build communities through peer recognition and feedback. Workday Human Capital Management (HCM), the HCM application which the company also uses internally, has a feedback feature that allows people to recognize and give feedback to their colleagues anytime. With the help of the PA team, the company realized it was taking new employees around 145 days to receive their first peer recognition which, for some job profiles, was a bit longer than expected. In order to ramp up and accelerate the time to recognition, the analytics team launched a new pilot program called “MatchUp” that uses a serendipity algorithm to pair a new employee with someone in the organization to have a conversation about what it is means to work at Workday. Having conversations about the culture of the organization resulted in positive impact on the peer recognition network as new employees felt a sense of inclusion, and began receiving recognition and feedback more quickly.

One of the ways Telstra, an Australian telecommunications company, strengthens and maintains trust is by sharing responsibility and access with employees to its own data. The company maintains an internal site called MyCareer that allows employees to keep and update their own data, and even challenge any incorrect or incomplete inputs.23

“As an employer, we should allow employees to manage aspects of their data, and for it to be a joint exercise.”

David Burns, group executive, global business services, Telstra

In addition, for the PA team at Western Digital, data ethics and transparency are very important. Questions, such as what data they are collecting, what they are going to do with it, how will it benefit the organization and the employees, and what will happen with the results, are central to its approach. If the PA team solicits feedback or collects data for a leader, the team ensures that high-level results are shared with the wider team. Such actions go a long way in building trust and communicating that organizations value employees for their contributions.

One interviewee spoke for many when he said:

“Create trust and transparency in everything you do. Share with employees what you measure and be conscious about it. Employees have to trust and understand what you do, otherwise you will lose them.”

Patrick Coolen, global head of people analytics, ABN Amro

Trust during crises

People analytics is playing a central role during the current times to help leaders learn through the data. At Microsoft, leaders began leveraging their workplace analytics data to understand how employee communities have changed. They were able to start looking at data for their Chinese employees early in the pandemic and used that insight to provide different types of support. While the company expected to see a shrinkage of networks, instead, Microsoft found that more than 25% of employees in China experienced almost no change or were within 10% of the original size of their networks before the pandemic. Additionally, 1 out of every 6 employees had networks that were 30% larger than before. This indicated to the leaders and managers that cross-team and interorganizational collaboration was happening. In addition, the analytics team also found an 11% decline in longer meetings and a 22% increase in shorter meetings (see Figure 9). This wasn’t surprising as employees were moving hallway conversations to shorter virtual meetings. All this data reflected that people were adapting as well as adopting new solutions to working remotely – from daily drop-in calls to learning to connect in new and innovative ways. By tracking such data, leaders and managers have been able to monitor behaviors, take action, implement changes, and make further tweaks as needed.24

Figure 9: Percentage Change in Microsoft China Employees’ Networks During Work from Home | Source: PAFOW Europe Online, 2020.

Another approach is looking at what different employees need from organizations during the crisis. For example, one organization found that different demographic groups had very different needs, and that if solutions were more targeted, employees would be more satisfied with them. For example, while about 24% of respondents indicated they miss social interactions the most, for 51% of the respondents, it’s not even among their top 10 issues they are currently facing. The organization could then use this information to design targeted interventions and make decisions about investments in programs.

Context-based insights have been equally crucial for Standard Chartered Bank as they begin to think about bringing people back to office spaces. The bank’s Global Head of HR, Tanuj Kapilashrami, has been interested in understanding the cultural learnings that are emerging out of this crisis and how they will affect the traditionally hierarchical organization of the bank. To that end, they rolled out a series of polls for all people leaders, around 1,400 of them, to ask them about the support available to lead during this crisis. The poll allowed the leaders and managers to input their own questions and vote on the ones they wanted to know most about. The findings revealed a significant difference in the way people were thinking about going back to work. For example, while people based in the western part of the world were resistant to going back to office spaces and were managing adequately working from home and being productive, those in the east were more open to the idea of going back to the offices due to issues such as a lack of necessary infrastructure and cultural context to allow them to work from home.

We’re sure there are other ways to engender trust – especially when it comes to issues like normalizing failure. Let us know what you think:

Conclusion

Let’s return to our running example of the octopus. Similar to how its 8 arms can function independently of each other and are thus more aware and responsive to its surroundings and environment, organizations too need to activate and enable their many “arms.” This will allow them to become responsive to their surrounding disruptions and environment, while the center ensures they all work together toward a larger goal.

Organizations can do this by leveraging the 4 lenses – respect, distributed authority, transparency and growth, and trust – to enable their people practices. PA teams have a crucial role in helping their organizations achieve this by doing things like collecting employees’ perspectives on what they need from the workplace, making data more broadly relevant and accessible, providing managers and employees with insights to manage their performance, and supporting and putting in place metrics that really measure responsivity. To put it bluntly, organizations will struggle to be responsive without a strong and aligned people analytics team.

The current crisis has seen many PA practitioners do amazing work to help their organizations respond effectively. However, this work has required many of them and their organizations to bend and flex in difficult – and sometimes unsustainable – ways. Our hope is that, with the approaches laid out in this article, PA leaders can help create an octopus-like organization, which can both be flexible and responsive to certain types of challenges, while still maintaining a coherent and clear central direction. The volatility and uncertainty of this moment is here to stay. By designing for responsivity, organizations can be ready for “the now of work.”

We would like to acknowledge the contributions made by those who gave their time to this research by speaking to us and sharing their thoughts and insights. In particular, we would like to thank Marilyn Becker, Patrick Coleen, Brian Fruchey, Nicholas Garbis, David Green, Blair Hopkins, Dawn Klinghoffer, RJ Milnor, Annemieke Nennie, Alexis Saussinan, Ben Teusch, Phil Willburn, and Michael Arena.

There are many others whom we cannot name publicly but would like to extend our gratitude, nonetheless. You know who you are. Our research would not have been possible without all of these contributions.

RedThread Research is an active HRCI provider